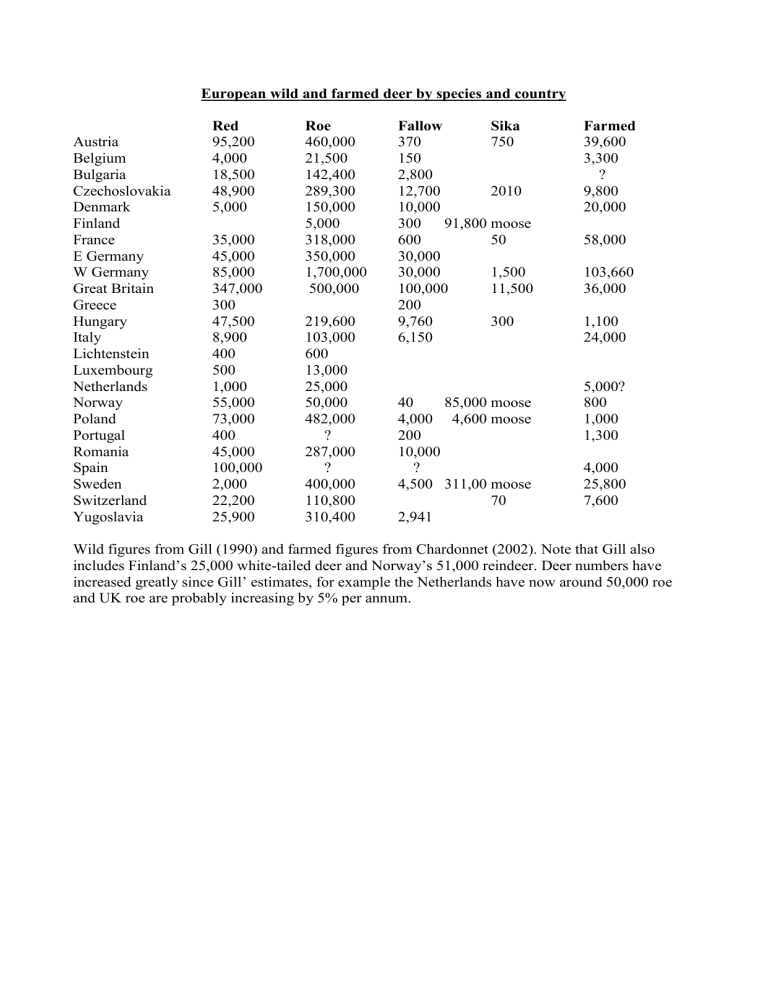
European wild and farmed deer by species and country
Austria
Belgium
Bulgaria
Czechoslovakia
Denmark
Finland
France
E Germany
W Germany
Great Britain
Greece
Hungary
Italy
Lichtenstein
Luxembourg
Netherlands
Norway
Poland
Portugal
Romania
Spain
Sweden
Switzerland
Yugoslavia
European wild and farmed deer by species and country
Red
95,200
4,000
18,500
48,900
5,000
Roe
460,000
21,500
142,400
289,300
150,000
Fallow
370
150
2,800
12,700
10,000
Sika
750
2010
35,000
45,000
85,000
2,000
22,200
25,900
347,000
300
47,500
8,900
400
500
1,000
55,000
73,000
400
45,000
100,000
5,000
318,000
350,000
300 91,800 moose
600 50
30,000
1,700,000 30,000
500,000 100,000
200
1,500
11,500
219,600
103,000
600
13,000
25,000
50,000
482,000
?
287,000
?
400,000
110,800
310,400
9,760
6,150
300
40 85,000 moose
4,000 4,600 moose
200
10,000
?
4,500 311,00 moose
2,941
70
Farmed
39,600
3,300
?
9,800
20,000
58,000
103,660
36,000
1,100
24,000
5,000?
800
1,000
1,300
4,000
25,800
7,600
Wild figures from Gill (1990) and farmed figures from Chardonnet (2002). Note that Gill also includes Finland’s 25,000 white-tailed deer and Norway’s 51,000 reindeer. Deer numbers have increased greatly since Gill’ estimates, for example the Netherlands have now around 50,000 roe and UK roe are probably increasing by 5% per annum.
Country
Information at 2003 for numbers of farmed deer and farms for some European countries.
Nos. farms Nos. red deer Nos. fallow deer
Benelux 1500 1,200 1,200
200 5-8,000 Czech Republic
Denmark
Norway
142
51
4,000
500
16,000
150
Poland 60
United Kingdom* 311
700
30,000
4,000
2,500
Figures supplied by FEDFA representatives in January 2004.
*England has approximately 17,000 fallow and 7,000 red within its parks
Other deer farming figures which are less easily verified are Germany: 103,660, Italy 24,000 and
Sweden 25,800 – all predominantly fallow
Domestic sales no carcase inspection
Wild
Export sales carcases inspected
Park
DEER
Farmed
Ante mortem and carcase inspection
Price paid to hunter for wild and park:
£ 0.40 /kg (about $ 1 NZ/kg)
Price paid to farmer £ 3.20/kg (about $ 8 NZ/ kg)
Table 1. Estimated growth in British deer populations
:
Species
Estimated populations in 1970’s Estimated population in 1990’s
Red deer 190,000 360,000
Roe deer 200,000 500,000
Fallow deer 50,000 100,000
Sika 1,000 11,500
Muntjac 5,000 40,000
(Wilson, 2003 based on Gibbs et al. 1975, and English Nature estimates for 1990’s)
Comparison of German hunting returns for 2001-2 with the five year average.
Species 2001-2 Five year average
Red deer 57,593
Fallow deer 48,951
Roe deer 1,060,272
52,290
42,756
1,051,142
(Data from Deutscher Jagdschutz-Verband, Johannes-Henry Strasse 26,
53113 Bonn, Germany )
French hunting returns for 1999-2000
Red deer 33,307
Roe deer 408,627
French hunters declining 22.7% over last fifteen years
Spanish hunters declining 5% per annum, Italian 10% per annum
Costs: road traffic accidents damage to crops trees gardens environment
Deer
Benefit: biodiversity tourism recreational hunting healthy food
The reasons for increasing European wild deer populations.
Human populations more urbanised
Less hunters
Less predators
Less people working in the country and eating game
Less agricultural pressure to reclaim and produce more
More fertilisers used
Milder winters, more storms
Woodlands less used
More amenity tree planting
Suburban gardens and parks
Foot and Mouth Disease in deer.
Epidemics in free-living deer: reindeer in Russian tundra 1855, 1896 & 1955
(Gribanov 1958; Ogryzkov 1963) white-tailed deer in California 1924-6
(Mohler 1925; Keane 1926)
Isolated cases:
Moose (Magnusson 1939)
Red deer (Stroh 1912; Cohrs & Weber 1939)
Roe deer (Stroh 1912, 1938, 1939; Rosenhaupt 1938; Christiansen
1939; Cohrs & Weber 1939; Sallinger 1939)
Fallow deer (Bartels & Claassen 1936)
Infected deer in zoos:
Numerous reviewed by Thalmann & Neckler 2001
Muntjac (Bhattacharya et al. 2003)
Experimental infections:
Moose, red, roe, fallow (Boukhtiarov et al. 1965,1968;
Dzhupina et al. 1965; Ercegovac et al. 1968)
Red, fallow, sika, roe, muntjac (Forman and Gibbs, 1974)
White-tailed deer (McVicar et al. 1974)

