CHS Science Dept
advertisement
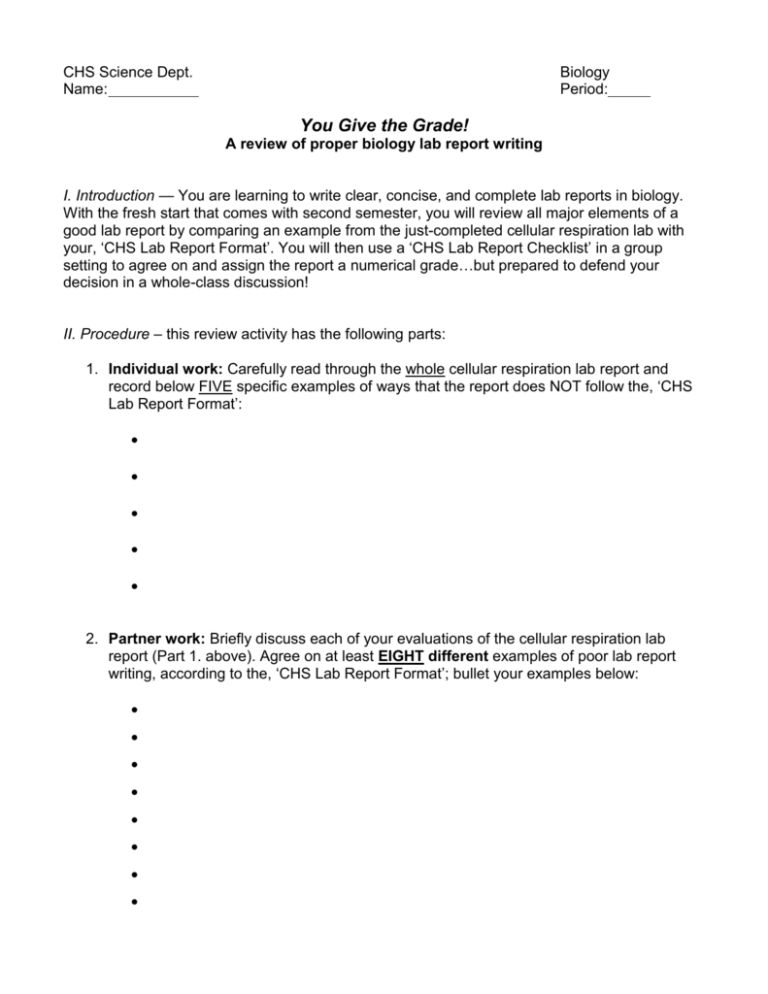
CHS Science Dept. Name: Biology Period: You Give the Grade! A review of proper biology lab report writing I. Introduction — You are learning to write clear, concise, and complete lab reports in biology. With the fresh start that comes with second semester, you will review all major elements of a good lab report by comparing an example from the just-completed cellular respiration lab with your, ‘CHS Lab Report Format’. You will then use a ‘CHS Lab Report Checklist’ in a group setting to agree on and assign the report a numerical grade…but prepared to defend your decision in a whole-class discussion! II. Procedure – this review activity has the following parts: 1. Individual work: Carefully read through the whole cellular respiration lab report and record below FIVE specific examples of ways that the report does NOT follow the, ‘CHS Lab Report Format’: 2. Partner work: Briefly discuss each of your evaluations of the cellular respiration lab report (Part 1. above). Agree on at least EIGHT different examples of poor lab report writing, according to the, ‘CHS Lab Report Format’; bullet your examples below: 3. Group work: You should briefly review your bulleted examples of poor lab report writing (Part 2. front page). Use your ‘CHS Lab Report Checklist’ to evaluate and assign sectional (#1- #8) points. Now, within your group discuss and debate the reasons why you assigned the point values you did. Once done, come up with a group score you all agree with for each section. Write a ONE paragraph (4-5 complete sentences) summary below of TWO major problems with the cellular lab report AND record the point value you agree as a group to assign the entire lab report: My score Group score 1 Title/FQ: 2 TQ: 3 Background: 4 Hypothesis: 5 Protocol: 6 Data: 7 Analysis: 8 Conclusion: Our Groups Cell Respiration Lab Report Grade: / 200 points 4. Class discussion: Based on the class discussion of the cellular respiration lab report, write a ONE paragraph (4-5 complete sentence) justification below for not changing your point value OR changing it. 5. Final individual reflection: Based on completing this activity AND reflecting on your lab report writing first semester, describe below THREE specific ways that you are going to improve your lab report writing in biology second semester. Crickets are Cool! Fundamental Question: What factors affect the rate of lactic acid fermentation? Testable Question: How will a cool environment affect the respiration rate of crickets as measured by a CO2 probe in parts per million (ppm). Background: Cell respiration is an important oxygen requiring process for all organisms (source—Wikipedia. ‘cell respiration’. http://en.wikipedia.org/wiki/Cell_respiration). It occurs in both the cytoplasm and the mitochondria of cells and has three stages—glycolysis, the Krebs cycle, and the electron transport chain. Cellular respiration can be affected by oxygen levels, the availability of glucose, and temperature. We have learned in class that cell respiration is related to photosynthesis in that the reactants of one become the products of the other. For example, the glucose and oxygen produced in photosynthesis by autotrophs becomes reactants in cellular respiration. Consumers can only carry out cell respiration but autotrophs can complete both chemical reactions. Hypothesis: If crickets are placed in cooler environment by using an ice bath, they will have a lower ppm of CO2 than crickets maintained at room temperature. Protocol: Materials—crickets; 1 CO2 gas probe; 1 Vernier logger pro; 1 250 ml respiration chamber; 1 thermometer; ice water. Procedures: Add crickets Set up Vernier system for measuring CO2 levels; plug in probe, respiration chamber and LoggerPro Turn on computer Plug in CO2 probe into respiration chamber Add respiration chamber with cricket to ice water bathe Start collecting data by clicking on the ‘collect’ icon Plug in probe Observe for 10 minutes Measure temperature of water Record data on in data table Graph data Data: Time (sec): 0.0 0.5 1.0 1.5 2.0 2.5 3.0 3.5 4.0 4.5 5.0 5.5 6.0 6.5 7.0 7.5 8.0 8.5 9.0 9.5 10.0 ‘Crickets on Ice’: Our Data Table CO2 (ppm) treatment group CO2 (ppm) control group (two (two replication average): replication average): 454 527 474 544 481 540 486 535 491 527 496 542 503 542 500 549 500 547 503 544 508 554 500 554 498 557 503 559 498 566 500 566 493 566 505 566 508 571 505 574 500 574 We observed that the crickets under cool temperatures did not move around as much as when we tested them at room temperature. The average cool temperature for both replications of the treatment group was 6 oC. The average room temperature for two replications of the control group was 23 oC. Graph: Analysis: We thought that the ten crickets placed in a cooler environment would have a lower ppm of CO2 exhaled than the ten crickets maintained at room temperature because temperature affects the rate of chemical reactions. Cell respiration is a series of chemical reactions with three major stages. We actually found that the temperature that crickets are kept at seemed to affect their CO2 ppm released. The crickets in our treatment group, averaged for two replications, started with 454 ppm CO2, the amount rose to a high of 508 ppm, but the readings stabilized around 500 ppm from 3 to10 minutes of the test. This generally makes sense because we know from our background review that the release of CO2 by the crickets should have slowed down a lot with cooler temperatures, such as our average of 6oC because cell respiration is a series of chemical reactions that become slower with lower temperatures. We are not sure why it did not change much at all for seven minutes though. The control group, replicated twice, started at 527 ppm CO2 and consistently rose to 574 ppm after ten minutes at room temperature. We expected this as our crickets constantly released CO2 as part of their cell respiration occurring at an average room temperature of 23 oC. We also observed during the experiment that the crickets under cool temperatures did not move around as much as when we tested them at room temperature. Less movement means less of a need to release energy from glucose through cell respiration, so crickets in the treatment group would have released less CO2. If we were to do the experiment again, we would like to have had enough time to run both the control group and treatment group one more time for a total of three replications of each. We know that increasing replications usually improves the quality of the data to answer the fundamental question. We would also like to have been able to know the actual temperature of the treatment group of crickets inside the respiration chamber rather than just the temperature of the ice water outside the chamber. One source of error is that we had to hand draw the ‘best fit’ lines for our graph rather than having the computer software do it for us because we had printing problems. Another potential source of error is that on the second day of the lab, there were not enough live crickets left to have two different sets of ten for both our control and treatment groups. We ended up having to use four crickets from the treatment group in our second control group test. It may have taken them some time to ‘warm up’ again to the higher temperatures, maybe affecting the overall CO2 levels for the control group test. Control: The data supports our hypothesis that ten crickets placed in a cooler environment for ten minutes would have a lower ppm of CO2 exhaled than the ten crickets maintained at room temperature for ten minutes, measured with the same equipment and crickets of the same size and gender, because temperature affects the rate of chemical reactions. CO2 released by crickets in the control group started at 527 ppm and constantly rose to a high of 574 ppm in ten minutes. The ‘best fit’ line of the graphed data showed that as time increased CO 2 increased as well. Our replicated treatment group data rose for the first three minutes, from 454 ppm to 503 ppm in three minutes and then stabilized for the remaining seven minutes of the test. We messed up this best fit line: a best fit line of our graphed treatment group data would show a much smaller increase of CO2 over time. Our data suggests that temperature is a factor that affects the rate of lactic acid fermentation in crickets. Crickets maintained at an average temperature of 6oC had a lower rate of CO2 released over ten minutes than cricket tested for ten minutes at an average temperature of 23oC. Would increasing the temperature above 23oC cause the CO2 exhaled by crickets over ten minutes to increase?
