How-Many-Crickets
advertisement
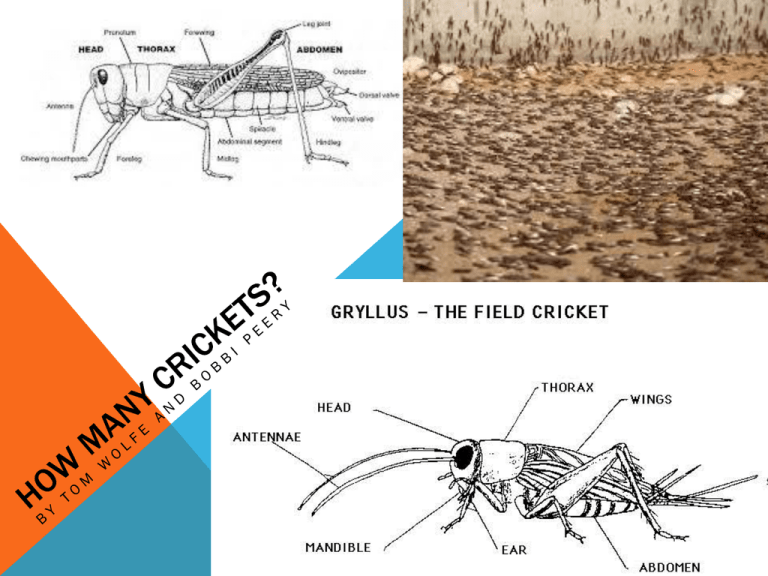
ENGAGE The teacher will provide a myth about crickets, and some statistics about the number of certain endangered animal species. The question is posed “How do scientists count ?” Students will be drawn into this lesson by making a Venn diagram comparing crickets and grasshoppers. EXPLORE The teacher will provide students with paper the contains different colored dots, and at the right time, an overhead transparency with a 1 square inch grid. The student will use the grid to estimate the number of dots on the paper. EXPLAIN The teacher will encourage students to share their findings by recording them on the white board. The students will share their findings and explain the process that was used to find their estimates. They will come up with the strategy to be used to estimate the number of crickets in the school yard. EXTEND The teacher will help students set up a 10 by 10 meter grid using stakes and rope to make one by one meter squares. The student will use the strategies discovered in the explore time to estimate the number of crickets in the 100 square meter area. Then students will be asked to use proportionality to predict the number of crickets in a larger area. EVALUATE The teacher will instruct the student to take the mathematical data and graph it . The student will determine if the population is evenly distributed, why some places may be more populated to the other and is the graph based on the data accurate and why?
