Episode 122: Using an oscilloscope
advertisement
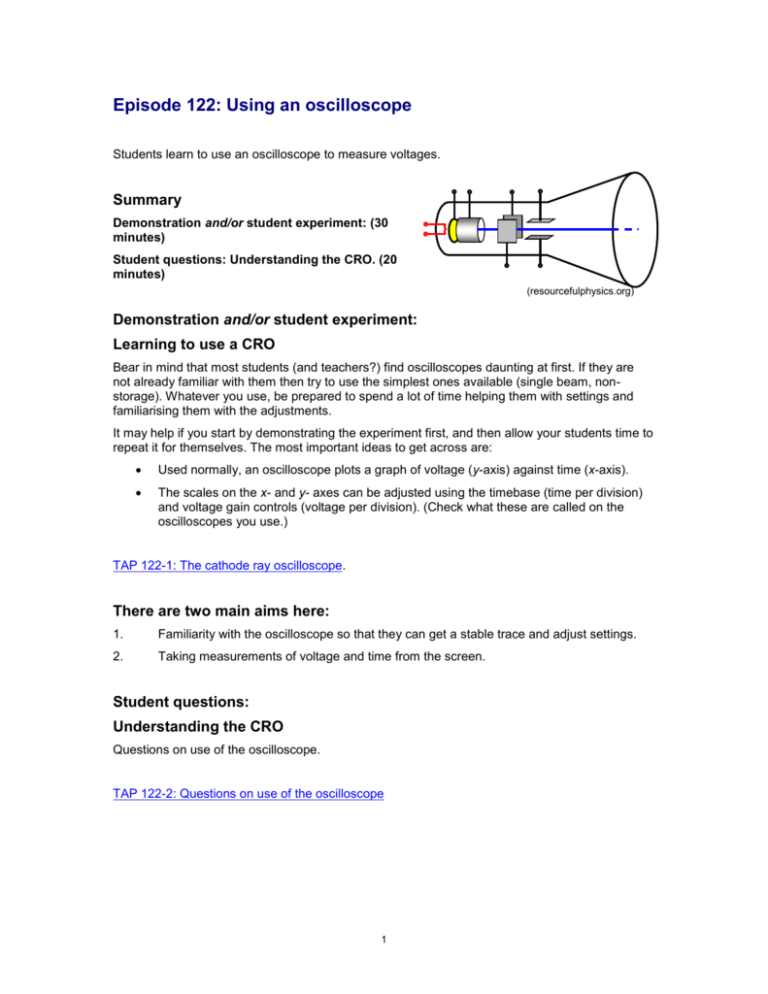
Episode 122: Using an oscilloscope Students learn to use an oscilloscope to measure voltages. Summary Demonstration and/or student experiment: (30 minutes) Student questions: Understanding the CRO. (20 minutes) (resourcefulphysics.org) Demonstration and/or student experiment: Learning to use a CRO Bear in mind that most students (and teachers?) find oscilloscopes daunting at first. If they are not already familiar with them then try to use the simplest ones available (single beam, nonstorage). Whatever you use, be prepared to spend a lot of time helping them with settings and familiarising them with the adjustments. It may help if you start by demonstrating the experiment first, and then allow your students time to repeat it for themselves. The most important ideas to get across are: Used normally, an oscilloscope plots a graph of voltage (y-axis) against time (x-axis). The scales on the x- and y- axes can be adjusted using the timebase (time per division) and voltage gain controls (voltage per division). (Check what these are called on the oscilloscopes you use.) TAP 122-1: The cathode ray oscilloscope. There are two main aims here: 1. Familiarity with the oscilloscope so that they can get a stable trace and adjust settings. 2. Taking measurements of voltage and time from the screen. Student questions: Understanding the CRO Questions on use of the oscilloscope. TAP 122-2: Questions on use of the oscilloscope 1 TAP 122- 1: The Cathode ray oscilloscope Basic operation Before doing the experiments you should adjust the controls for focus, brilliance, X and Y shift until you have a dot in the middle of the screen. Y plates electron gun cathode fluorescent screen electron beam anode X plates The simplified diagram above shows the inside of a cathode ray oscilloscope. Copy the diagram into your books. These experiments will help you understand how a cathode ray oscilloscope works. You will need a CR0, a battery pack, a high current power supply, and a microphone and leads. Instructions Switch on your oscilloscope and adjust the controls to give a straight line across the centre of the screen. The Y gain should be set at 1V / division and the time base set at 1 ms / division, 1. Connect one 1.5 V cell to the Y inputs and adjust the Y gain, if necessary, so that the line moves up 1.5 divisions. AFTER THIS DO NOT ALTER THE Y SHIFT OR Y GAIN. 2. Now connect two cells and then three cells. Record the line deflection each time. 2 3. Reverse the leads and repeat number two. 4. Now connect the 1 V ac supply from the high current power supply (Extra low voltage supply or Westminster power supply) to the Y inputs. If the signal source and oscilloscope both have earthed terminals make sure that the earthed lead of the oscilloscope (often black) is connected to the earthed terminal of the supply (often yellow), or you will short out the signal generator through the CRO. Record the size and shape of the trace. Repeat with the 2 V ac input and then the dc input, recording the trace each time. You must have a steady trace for each experiment. 5. With the 2 V ac connected try increasing the Y gain. Then try varying the variable-control. Record the results. 6. Now connect a microphone to the Y inputs and record the effect of talking into it. 3 TAP 122- 2: Questions on use of the oscilloscope 1. In what ways is an oscilloscope a voltmeter? 2. What does an oscilloscope offer which a voltmeter does not? 3. An oscilloscope is set to 0.5 V / cm vertically and 1 s / cm horizontally. (a) Sketch the trace that would be seen if a 1.5 V cell was connected to the y-input. (b) Sketch the trace that would be seen if a square wave signal of frequency 1 Hz and amplitude 0.5 V (positive and negative) is connected to the input. 4. With the timebase switched off an alternating voltage moves the spot on the screen up and down once in 0.20 s. Its range of movement is 4.0 cm and the y-gain is set at 20 mV / cm (a) What is the amplitude of the signal? (b) What is the frequency of the signal? 4 Answers and worked solutions 1 For an oscilloscope deflection is proportional to potential difference, and the CRO has high resistance, so it has all the properties of an ideal voltmeter. Unlike most voltmeters, many commercial CROs have one side of each input is earthed. This does not normally matter, but if the CRO is being used with an earthed supply, care must be taken to connect the earthed CRO input to the earthed side of the supply. 2 Can display variation of potential difference with time, giving a graphical display. It can do this even with very rapid variations. With many oscilloscopes two signals can be displayed at the same time, on separate voltage against time graphs. Often the two signals can be plotted against each, as an “X-Y” plot. 4 20 mV cm-1 x 4 cm = 80 mV. Amplitude is half this so 40 mV. Time for one oscillation is 0.2 s so f= 1 / 0.2 s = 5 Hz 5
