Pearson Goodness of Fit Test for a Poisson Distribution
Pearson Goodness of Fit Test for a Poisson Distribution 1
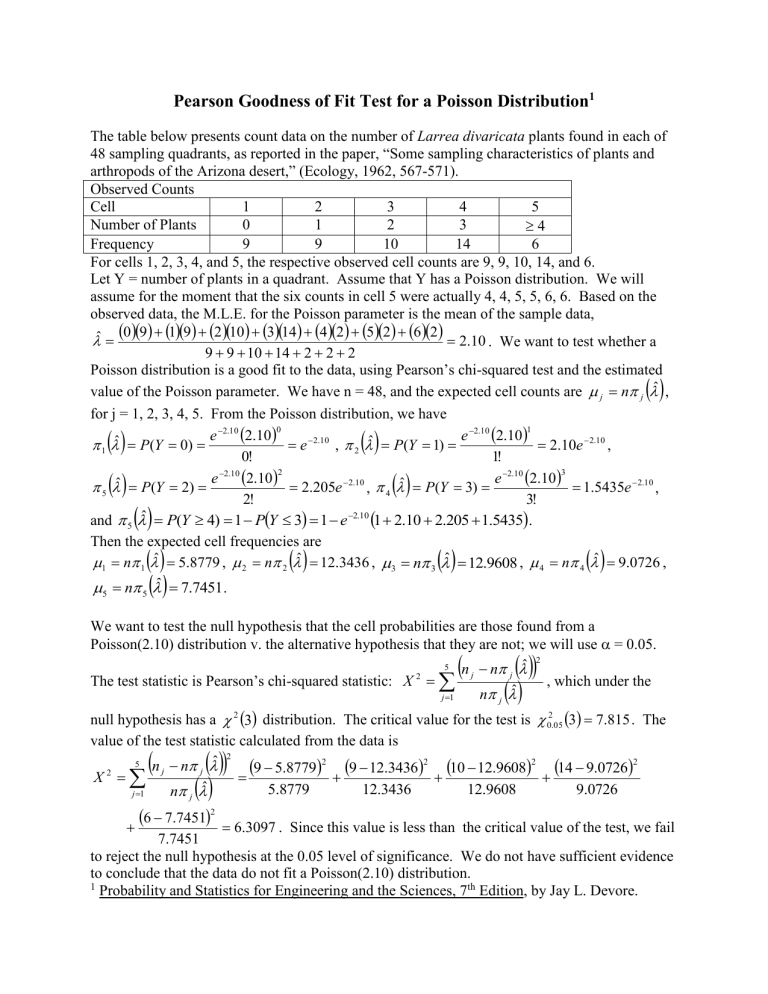
The table below presents count data on the number of Larrea divaricata plants found in each of
48 sampling quadrants, as reported in the paper, “Some sampling characteristics of plants and arthropods of the Arizona desert,” (Ecology, 1962, 567-571).
Observed Counts
Cell
Number of Plants
Frequency
1
0
9
2
1
9
3
2
10
4
3
14
5
4
6
For cells 1, 2, 3, 4, and 5, the respective observed cell counts are 9, 9, 10, 14, and 6.
Let Y = number of plants in a quadrant. Assume that Y has a Poisson distribution. We will assume for the moment that the six counts in cell 5 were actually 4, 4, 5, 5, 6, 6. Based on the observed data, the M.L.E. for the Poisson parameter is the mean of the sample data,
ˆ
9
2
9
10
10
3
14
14
2
4
2
2
2
5 2
6 2
2 .
10 . We want to test whether a
Poisson distribution is a good fit to the data, using Pearson’s chi-squared test and the estimated value of the Poisson parameter. We have n = 48, and the expected cell counts are
j
n
j
, for j = 1, 2, 3, 4, 5. From the Poisson distribution, we have
1
5 and
5
P
( Y
P ( Y
0 )
2 )
P ( Y
e e
4 )
2
.
10
2 .
10
1
2 .
10
2 !
P
Y
0 !
2 .
10
2
0
3
e
2 .
10
1
,
2 .
205 e
e
2
2 .
10
2 .
10
,
4
1
P ( Y
2 .
10
P
1 )
( Y
e
2 .
205
2
3 )
.
10
2 .
10
1 !
e
2 .
10
1 .
5435
1
2 .
10
3
3 !
.
2 .
10 e
2 .
10
,
1 .
5435 e
2 .
10
,
Then the expected cell frequencies are
1
n
1
5 .
8779 ,
2
n
2
12 .
3436 ,
3
n
3
5
n
5
7 .
7451 .
12 .
9608 ,
4
n
4
9 .
0726 ,
We want to test the null hypothesis that the cell probabilities are those found from a
Poisson(2.10) distribution v. the alternative hypothesis that they are not; we will use
= 0.05.
The test statistic is Pearson’s chi-squared statistic: null hypothesis has a
X
2 j
5
1
n j
n
n
j
j
2
distribution. The critical value for the test is
2
, which under the
2
0 .
05
7 .
815 . The value of the test statistic calculated from the data is
X
2 j
5
1
n j
n
n
j
2
9
5 .
8779
5 .
8779
9
12 .
3436
10
12 .
3436
6
7 .
7451
2
7 .
7451
6 .
3097
12 .
9608
14
12 .
9608
9 .
0726
2
9 .
0726
. Since this value is less than the critical value of the test, we fail to reject the null hypothesis at the 0.05 level of significance. We do not have sufficient evidence to conclude that the data do not fit a Poisson(2.10) distribution.
1
Probability and Statistics for Engineering and the Sciences, 7 th
Edition, by Jay L. Devore.


