Figure S2 physical coverage distribution of long
advertisement
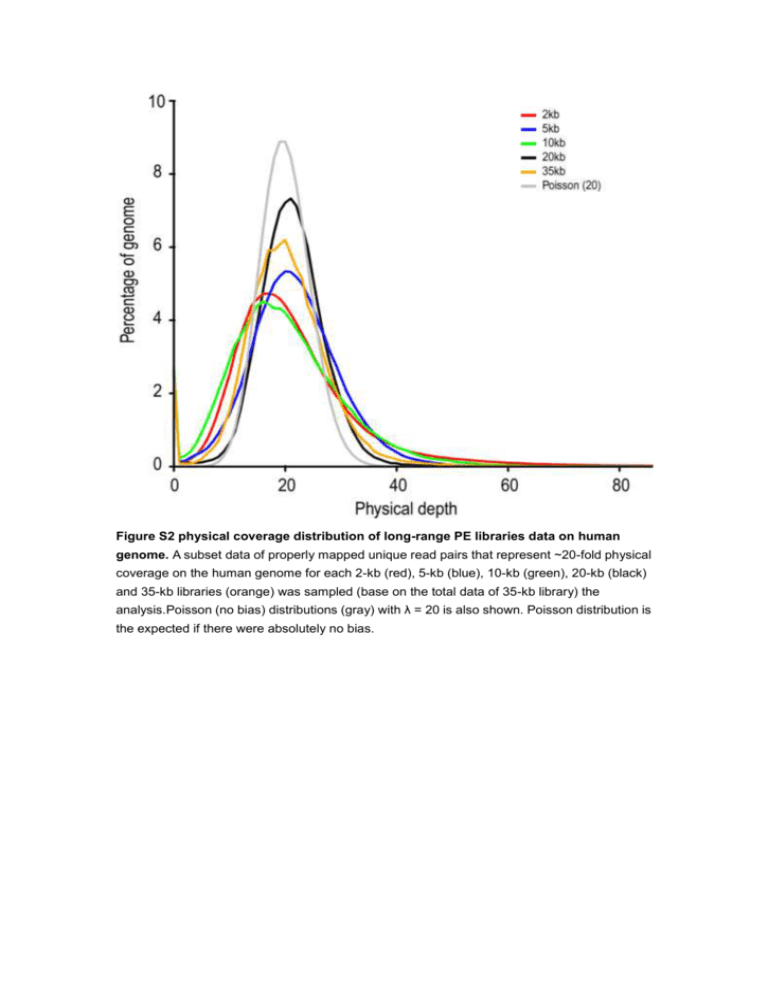
Figure S2 physical coverage distribution of long-range PE libraries data on human genome. A subset data of properly mapped unique read pairs that represent ~20-fold physical coverage on the human genome for each 2-kb (red), 5-kb (blue), 10-kb (green), 20-kb (black) and 35-kb libraries (orange) was sampled (base on the total data of 35-kb library) the analysis.Poisson (no bias) distributions (gray) with λ = 20 is also shown. Poisson distribution is the expected if there were absolutely no bias.


