Force-field analysis map
advertisement
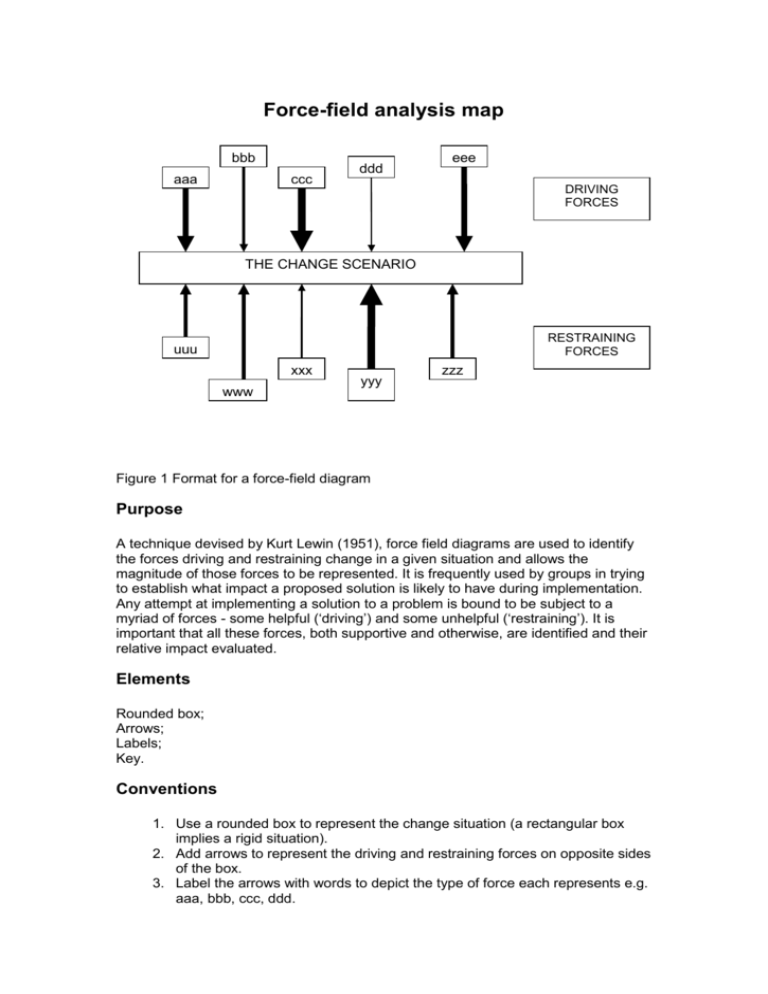
Force-field analysis map bbb aaa ccc ddd eee DRIVING FORCES THE CHANGE SCENARIO RESTRAINING FORCES uuu xxx www yyy zzz Figure 1 Format for a force-field diagram Purpose A technique devised by Kurt Lewin (1951), force field diagrams are used to identify the forces driving and restraining change in a given situation and allows the magnitude of those forces to be represented. It is frequently used by groups in trying to establish what impact a proposed solution is likely to have during implementation. Any attempt at implementing a solution to a problem is bound to be subject to a myriad of forces - some helpful (‘driving’) and some unhelpful (‘restraining’). It is important that all these forces, both supportive and otherwise, are identified and their relative impact evaluated. Elements Rounded box; Arrows; Labels; Key. Conventions 1. Use a rounded box to represent the change situation (a rectangular box implies a rigid situation). 2. Add arrows to represent the driving and restraining forces on opposite sides of the box. 3. Label the arrows with words to depict the type of force each represents e.g. aaa, bbb, ccc, ddd. 4. Add a key to show how the magnitude of the forces is represented by the thickness and the length of the lines i.e. thick arrows for stronger forces and thin arrows for weaker ones, and long arrows for longer lasting forces and short ones for shorter lasting forces. Guidelines 1. Listing all the driving and restraining forces is an excellent discipline because: (a) It helps to determine whether a proposed solution is practical or not. If the intensity of the restraining forces is overwhelmingly powerful the chance that the solution could be implemented is greatly reduced. A solution with a better relative balance between the driving and restraining forces should be preferred. (b) It provides the team with an inventory of the factors which are likely to facilitate and/or impede implementation, and with such knowledge steps can be taken to enhance the former and remove some of the latter. Altogether, it can assist the team to develop a strategy for amending or improving a solution to take account of the forces identified during the force-field analysis. 2. The procedure used is for the group members to list and discuss their perceptions of the driving and restraining forces. The group leader draws a diagram with all the driving forces as arrows facing downwards above the box and all the restraining forces as arrows facing upwards below the box. 3. Having identified all the driving and restraining forces applicable to the solution the team tries to determine the relative impact of each factor. It must try to reach consensus on the subject. Once this is achieved, it is normally shown by the relative thickness and lengths of the arrows on the diagram. The thickness represents the strength of the force i.e. thick arrows are stronger forces and vice versa while the length depicts the timescale over which the force is operating, e.g. short arrows can represent relatively short lived forces and vice versa. 4. Force-field analysis can also be used to present three different stimuli for thinking of new options or solutions. Because the field represents a kind of tugof-war, there are three ways to move the centre line in the direction of the more desirable future: Strengthen an already-present positive force Weaken an already-present negative force Add a new positive force. Ideas can then be generated around each of these three possibilities. Bibliography Lewin, K. (1951) Field Theory in Social Science, New York, Harper See also http://www.mindtools.com/pages/article/newTED_06.htm and http://www.valuebasedmanagement.net/methods_lewin_force_field_analysis.html
