Wang_EFSCEM_SuppInfo
advertisement
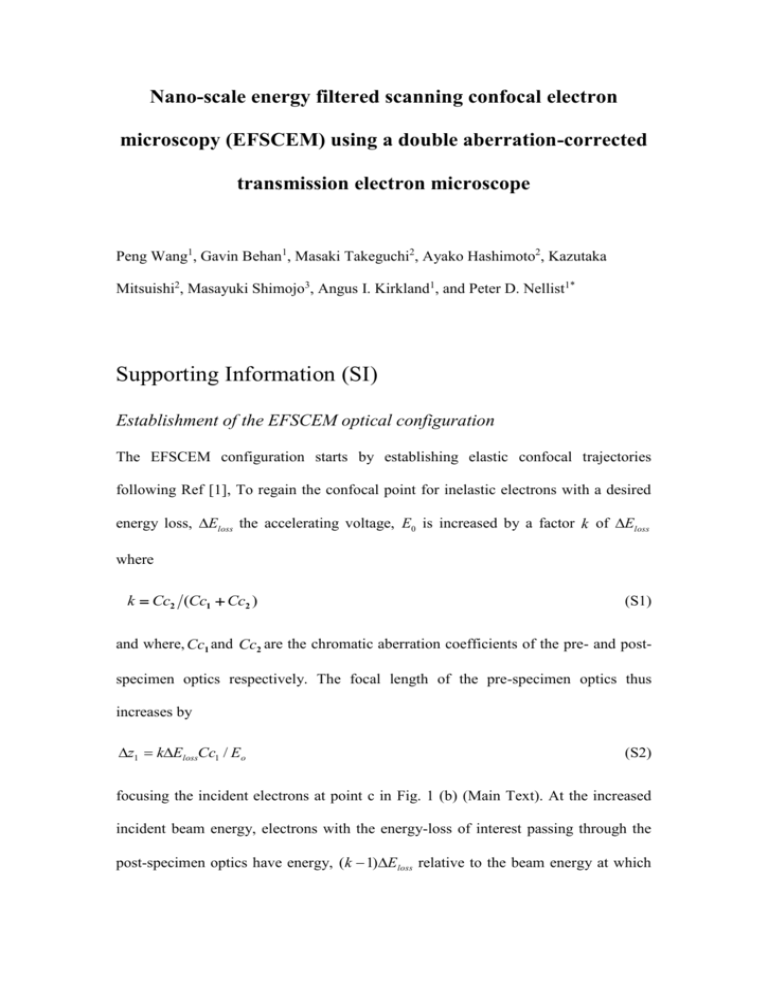
Nano-scale energy filtered scanning confocal electron microscopy (EFSCEM) using a double aberration-corrected transmission electron microscope Peng Wang1, Gavin Behan1, Masaki Takeguchi2, Ayako Hashimoto2, Kazutaka Mitsuishi2, Masayuki Shimojo3, Angus I. Kirkland1, and Peter D. Nellist1* Supporting Information (SI) Establishment of the EFSCEM optical configuration The EFSCEM configuration starts by establishing elastic confocal trajectories following Ref [1], To regain the confocal point for inelastic electrons with a desired energy loss, Eloss the accelerating voltage, E0 is increased by a factor k of Eloss where k Cc2 (Cc1 Cc2 ) (S1) and where, Cc1 and Cc2 are the chromatic aberration coefficients of the pre- and postspecimen optics respectively. The focal length of the pre-specimen optics thus increases by z1 kElossCc1 / Eo (S2) focusing the incident electrons at point c in Fig. 1 (b) (Main Text). At the increased incident beam energy, electrons with the energy-loss of interest passing through the post-specimen optics have energy, (k 1)Eloss relative to the beam energy at which the BFSCEM trajectory was established, and therefore the focal length of the postspecimen optics is reduced z 2 (k 1)ElossCc2 / E0 . (S3) Substituting (1) into (2) and (3) shows that z1 z 2 and therefore the changes in focal length of the pre- and post-specimen optics are exactly compensated, regaining the confocal trajectory for the desired energy loss. The final alignment step requires simply that the sample is lowered by a distance z1 to the confocal point. Establishing these conditions now takes a skilled operator approximately 30 minutes. Experimental: Instrument: The experiments reported were performed using the Oxford-JEOL 2200MCO with third order aberration correctors for both pre and post specimen optics and an in column energy filter (an upgraded version of the instrument described in Reference [2]). Samples: For both EFSTEM and the 1D EFSCEM experiments, the sample used was a holey carbon film obtained from Agar Scientific. Independent measurements of the thickness of the sample were carried out using the ratio of the strength of inelastic to elastic scattering [3] to give an estimate for the thickness of 25±5nm. For the 2D EFSCEM experiment, the specimen used was a perforated carbon film decorated with Au nanoparticles. Using same methods ,the thickness of this sample at point 1 (Fig. 3 (a) Main Text) was estimated at 65±7nm and 32±3nm at point 2. EFSTEM experimental configuration: EFSTEM is a non-confocal configuration as shown in Fig. S1. The one-dimensional EFSTEM scans in the z-direction were performed by changing the height of the sample using a piezo-driven sample stage. The sample was illuminated with a beam convergence semi-angle of 22 mrad. EFSTEM data was recorded using an energy filter [4] with a 20 eV Energy-selecting window (ESW), centred at an energy loss of 290 eV in order to record the carbon K-edge, and a collection semi-angle of 10 mrad into the spectrometer was used. Figure S1 shows the overall optical configuration for EFSTEM. EFSCEM experimental configuration: For both 1D and 2D EFSCEM optical sectioning experiments, the microscope was adjusted to the confocal mode for an energy loss of 290 eV to collect carbon K-edge scattering. 1D EFSCEM For 1D EFSCEM data acquisition, the sample was moved along the z-axis using a piezo-stage. Semi-angles of 22 and 36 mrad were used for the pre- and post-specimen lens apertures respectively, and data was recorded using ESWs of 1, 5 and 20 eV centred at a 290eV energy-loss and also with no ESW present. Series of images of the EF- confocal probe were recorded on a 4kx4k Gatan CCD camera with 4x pixel binning and a 4s dwell time. A movie composed of a series of experimental probe images with a 5eV ESW centred at 290 eV is shown as Movie S1. A virtual collector aperture with a diameter of 0.4 nm was applied to the stack of CCD images by integrating the intensities within a circular region centred at each probe image as shown in the insert (a) in Fig.2 (Main Text). The insert (b) in Fig. 2 shows that the signal is spread outside this aperture when the sample is located away from the confocal point giving rise to a strongly depth dependent signal (Fig. 2 (Main Text)) that accurately measures the height of the carbon film. 2D EFSCEM For the 2D experiments, a purpose designed piezo-driven stage-scanning system [5] was used to scan the sample in either two-dimensional lateral (x-y) scans, or to slice in depth, forming an (x-z) scan. For these experiments the CCD camera was replaced with a physical collector aperture corresponding to a diameter of 0.32 nm positioned in front of a fast electron detector, allowing two dimensional images to be recorded in approximately 40 s for a 512 x 512 pixel array [5]. The post-specimen optics were adjusted to give a numerical aperture with a 17.7 mrad semi-angle to exclude effects due to high order aberrations whilst the pre-specimen optical numerical aperture was maintained at 22 mrad. A 20 eV ESW was centered at an energy-loss of 290eV. 2D scans with an array size of 256 x 256 pixels were recorded in 35s by averaging 50 measurements to improve the signal to noise ratio in the final data. The pixel size in the images is 1.75 nm for both x and y directions and 21.09 nm for the z direction. The images in shown Figure 3 (Main Text) were cropped from these raw images. The depth line profiles in Fig. 3 c) and f) (Main Text) were subsequently generated using an integration width of 10 pixels along the dotted lines L1 (—) and L2 (---) in Figs. 3 b) and e) (Main Text), respectively. Z-Response (or Plane spread function) For a completely incoherent scattering object function V (R ) located at a height, z=0 and in the confocal condition, the intensity of the three-dimensional incoherent SCEM image[1] can be written as: I (R 1 , z) V (R) P1 (R R 1 , z) P2 (R 1 R, z) dR (S4) 2 2 in which we have used the notation provided in Reference[1]. The point spread function (PSF) for incoherent confocal imaging can thus be identified as: 2 PSF (R, z ) P1 (R, z ) P2 ( R, z ) 2 (S5) The z-response describes the depth resolution of a laterally extended object. For an infinitely thin incoherent scattering plane, the z-response is given by integrating the PSF in the R plane as: SCEM ( z) P1 (R, z) P2 (R, z) dR (S6) 2 2 Using the same analysis, for the STEM geometry, the z-response can be written as: STEM ( z) P1 (R, z) dR 2 (S7) which is constant due to the total intensity of the beam propagating through the plane for any value of z being unchanged. This lack of z-response for STEM is evident experimentally in Fig. 2 (Main Text), which confirms that the STEM cannot provide depth determination for an extended object. [1] P. D. Nellist et al., Applied Physics Letters 89, 124105 (2006). [2] J. L. Hutchison et al., Ultramicroscopy 103, 7 (2005). [3] R. F. Egerton, Electron Energy-loss Spectroscopy in the Electron Microscope (Springer, 1996). [4] K. Tsuno et al., J Electron Microsc 46, 357 (1997). [5] M. Takeguchi et al., J Electron Microsc 57, 123 (2008).
