Precipitation Conditions
advertisement
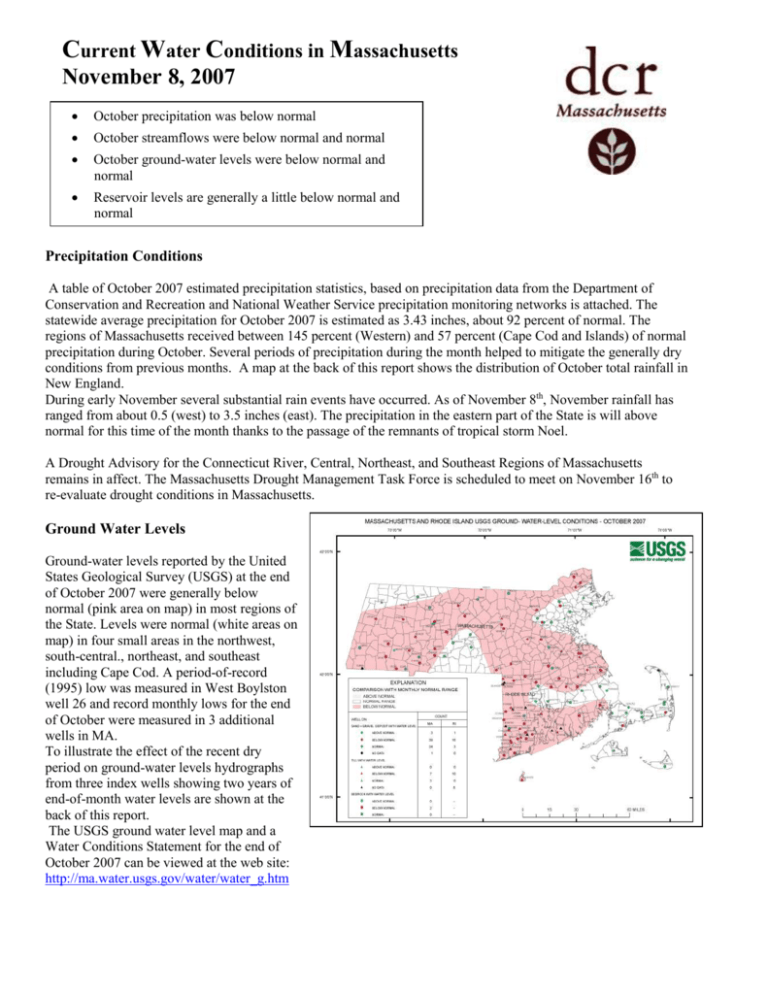
Current Water Conditions in Massachusetts November 8, 2007 October precipitation was below normal October streamflows were below normal and normal October ground-water levels were below normal and normal Reservoir levels are generally a little below normal and normal Precipitation Conditions A table of October 2007 estimated precipitation statistics, based on precipitation data from the Department of Conservation and Recreation and National Weather Service precipitation monitoring networks is attached. The statewide average precipitation for October 2007 is estimated as 3.43 inches, about 92 percent of normal. The regions of Massachusetts received between 145 percent (Western) and 57 percent (Cape Cod and Islands) of normal precipitation during October. Several periods of precipitation during the month helped to mitigate the generally dry conditions from previous months. A map at the back of this report shows the distribution of October total rainfall in New England. During early November several substantial rain events have occurred. As of November 8th, November rainfall has ranged from about 0.5 (west) to 3.5 inches (east). The precipitation in the eastern part of the State is will above normal for this time of the month thanks to the passage of the remnants of tropical storm Noel. A Drought Advisory for the Connecticut River, Central, Northeast, and Southeast Regions of Massachusetts remains in affect. The Massachusetts Drought Management Task Force is scheduled to meet on November 16th to re-evaluate drought conditions in Massachusetts. Ground Water Levels Ground-water levels reported by the United States Geological Survey (USGS) at the end of October 2007 were generally below normal (pink area on map) in most regions of the State. Levels were normal (white areas on map) in four small areas in the northwest, south-central., northeast, and southeast including Cape Cod. A period-of-record (1995) low was measured in West Boylston well 26 and record monthly lows for the end of October were measured in 3 additional wells in MA. To illustrate the effect of the recent dry period on ground-water levels hydrographs from three index wells showing two years of end-of-month water levels are shown at the back of this report. The USGS ground water level map and a Water Conditions Statement for the end of October 2007 can be viewed at the web site: http://ma.water.usgs.gov/water/water_g.htm Stream Flow At the end of October stream flows in the State that are monitored by the United States Geological Survey (USGS) were generally below normal (orange area) in most of Massachusetts. Stream flows were normal (areas in white) in river basins in northwestern Massachusetts. A new minimum monthly discharge for October was recorded on the Jones River in Kingston, MA. Hydrographs showing two years of monthly mean discharge at three index gages are shown at the end of this report. The graph below depicts a composite streamflow for Massachusetts as of November 7, 2007. The graph is a composite of 46 gages across the state with a long period of record. Below normal streamflow at the beginning of October has slowly recovered to near normal as a result of several rainfall events during October. In November, two rainfall events have contributed to increasing nearnormal flows. Additional information on streamflow is available from the USGS web page: http://ma.water.usgs.gov/water/waters.htm KEY: 1 = New record low for day 2 = < 10th percentile 3 = 10th – 24th percentile 4 = 25th – 74th percentile 5 = 75th – 89th percentile 6 = 90th percentile 7 = New record high for day 2 Water Supply Reservoir Levels Surface water reservoir percent full values for water supply sources provided by water suppliers are listed below. The reservoir levels listed are reported to be a little below normal for this time of year. Seventy-eight water suppliers shown on an October 9th map provided by MassDEP at the back of this report have instituted mandatory and voluntary water use restrictions. October /November 2007 Massachusetts Reservoir Status Percent Reservoir/City or Town Full Reservoir/City or Town Quabbin 89 Beverly/Salem Worcester 61.8 Lynn Cobble Mt./ Springfield 73 Taunton/New Bedford/Assawompsett Note: N.A. Indicates data not available for this report Percent Full 64 52.6 83.5 Fire Danger During October the cooler weather and rain events have resulted in a lowering of the fire danger and number of fires. Drought Indices/Forecasts The National Drought Mitigation Center’s (NDMC’s) November 6, 2007 Drought Monitor Map of Massachusetts shown at right indicates that about 15 percent of the south-central part of the State is in moderate drought and another 36 percent is abnormally dry. Standardized Precipitation Index: The Western Regional Climate Center’s (Desert Research Institute, University and Community College System of Nevada) 1, 3, 6, and 12-Month Standardized Precipitation Index through the end of October shows normal/extremely wet, moderately dry/moderately wet, normal, and normal/moderately wet conditions respectively, in Massachusetts. NWS/NOAA’s Climate Prediction Center: The U.S. Seasonal Drought Outlook dated November 1, 2007 shows that the drought in the southeast area of the State is expected to improve and impacts ease through January 2007. Extended Forecasts There is only a slight chance of showers/snow flurries (eastern MA) for Friday night-Saturday as a result of an ocean storm forecast to pass well to the east of NE. There is a possibility of additional showers next week as another frontal system passes the area. The National Weather Service Climate Prediction Center’s extended 6-10 and 8-14 day forecasts both indicate above normal rainfall and temperature. The 1-month forecast indicates normal rainfall and temperature. The 3-month forecast indicates normal rainfall and above normal temperature. 3 http://www.srh.noaa.gov/rfcshare/precip_analysis_new.php TOTAL RAINFALL OCTOBER 2007 This report was prepared by the Massachusetts Department of Conservation and Recreation. Data were obtained from the sources described in the report and October may be preliminary in nature. Additional information, previous and future water conditions reports can be found on our web site: http://www.mass.gov/dcr/waterSupply/rainfall/ 4 5 http://www.mass.gov/dep/water/resources/wateruse.htm 6

