doc - Cornell University
advertisement
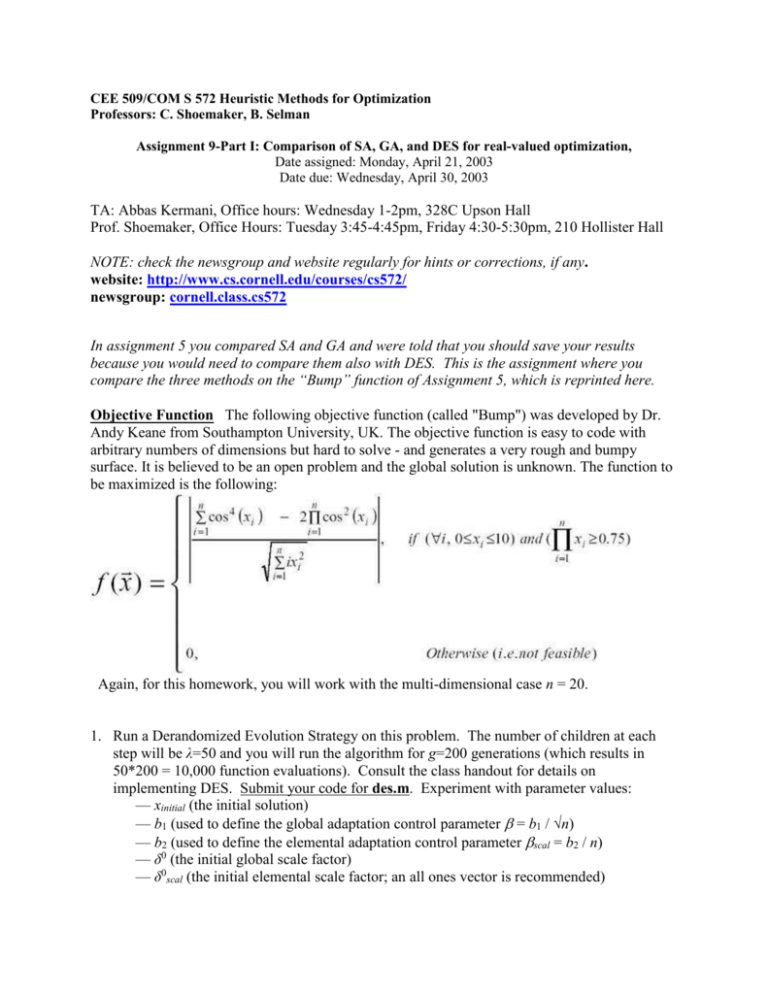
CEE 509/COM S 572 Heuristic Methods for Optimization Professors: C. Shoemaker, B. Selman Assignment 9-Part I: Comparison of SA, GA, and DES for real-valued optimization, Date assigned: Monday, April 21, 2003 Date due: Wednesday, April 30, 2003 TA: Abbas Kermani, Office hours: Wednesday 1-2pm, 328C Upson Hall Prof. Shoemaker, Office Hours: Tuesday 3:45-4:45pm, Friday 4:30-5:30pm, 210 Hollister Hall NOTE: check the newsgroup and website regularly for hints or corrections, if any. website: http://www.cs.cornell.edu/courses/cs572/ newsgroup: cornell.class.cs572 In assignment 5 you compared SA and GA and were told that you should save your results because you would need to compare them also with DES. This is the assignment where you compare the three methods on the “Bump” function of Assignment 5, which is reprinted here. Objective Function The following objective function (called "Bump") was developed by Dr. Andy Keane from Southampton University, UK. The objective function is easy to code with arbitrary numbers of dimensions but hard to solve - and generates a very rough and bumpy surface. It is believed to be an open problem and the global solution is unknown. The function to be maximized is the following: Again, for this homework, you will work with the multi-dimensional case n = 20. 1. Run a Derandomized Evolution Strategy on this problem. The number of children at each step will be λ=50 and you will run the algorithm for g=200 generations (which results in 50*200 = 10,000 function evaluations). Consult the class handout for details on implementing DES. Submit your code for des.m. Experiment with parameter values: — xinitial (the initial solution) — b1 (used to define the global adaptation control parameter = b1 / √n) — b2 (used to define the elemental adaptation control parameter scal = b2 / n) — δ0 (the initial global scale factor) — δ0scal (the initial elemental scale factor; an all ones vector is recommended) Indicate the best parameters you find. With the best parameters, calculate average and standard deviation fbest over 20 runs. Also note the best solution (maximum objective value) you obtain using DES. Submit a sample semilogx plot of fbest vs. function evaluations (from 1 to 10,000 with a spacing of 50 on the x-axis between each data point) for DES. 2. Compare the effectiveness of 3 algorithms (SA, GA, and DES) on the “Bump” problem. Here you will need your fbest averages and standard deviations from assignment 5 (for SA and GA). You will also need the best solution that the SA and the GA each found. a) On one figure, make a semilogx plot of the average of fbest vs. function evaluations for each algorithm. Remember that this means you will have your GA and DES data points spaced out by 50 units on the x-axis (since each generation of these algorithms involves 50 function evaluations). Make a similar plot of the standard deviation of fbest vs. function evaluations for each algorithm. b) From the plotted data, comment on which method seems to better and any other conclusions you would draw about these algorithms’ relative performance. Also, submit the best solution (x-vector of size 20) that was found among all three algorithms, and indicate which algorithm produced it. c) Do you think that one of the algorithms is conclusively better than the other? Explain your reasons. Do you have an idea why one algorithm is significantly better than the other? If you instead observe that they perform similarly well, explain why you think that happened.
