Meteorological Monsters
advertisement
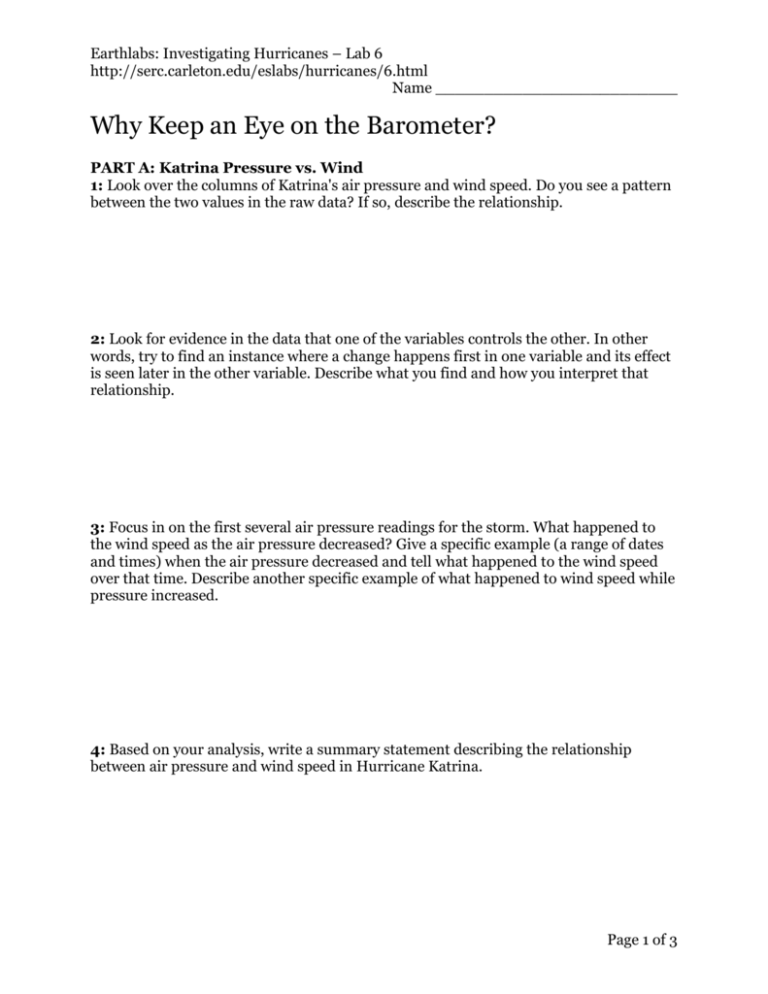
Earthlabs: Investigating Hurricanes – Lab 6 http://serc.carleton.edu/eslabs/hurricanes/6.html Name _________________________ Why Keep an Eye on the Barometer? PART A: Katrina Pressure vs. Wind 1: Look over the columns of Katrina's air pressure and wind speed. Do you see a pattern between the two values in the raw data? If so, describe the relationship. 2: Look for evidence in the data that one of the variables controls the other. In other words, try to find an instance where a change happens first in one variable and its effect is seen later in the other variable. Describe what you find and how you interpret that relationship. 3: Focus in on the first several air pressure readings for the storm. What happened to the wind speed as the air pressure decreased? Give a specific example (a range of dates and times) when the air pressure decreased and tell what happened to the wind speed over that time. Describe another specific example of what happened to wind speed while pressure increased. 4: Based on your analysis, write a summary statement describing the relationship between air pressure and wind speed in Hurricane Katrina. Page 1 of 3 Earthlabs: Investigating Hurricanes – Lab 6 http://serc.carleton.edu/eslabs/hurricanes/6.html Part B: Pressure-Wind Relationship 5: Use values from the graph to estimate how much the wind speed increased as the air pressure decreased by approximately 100 millibars. 6: The equation for the line is in the form y = mx + b. Plug an air pressure value (x) of 940 millibars into the equation and calculate the wind speed (y) predicted by the line. Show your work. Did the equation do a good job of predicting wind speed? 7: Do you think the trendline helps to clarify the relationship between air pressure and wind speed for this hurricane? Tell why or why not. Page 2 of 3 Earthlabs: Investigating Hurricanes – Lab 6 http://serc.carleton.edu/eslabs/hurricanes/6.html Part C: 2005 Pressure vs. Wind 8: Does the scatter plot for the 2005 Atlantic hurricane season show a similar relationship between pressure and wind speed as the Hurricane Katrina graph? Do you suppose the relationship between air pressure and wind speed in other years' hurricanes or in Pacific storms would be similar? Why or why not? 9: Based on your graph and trendline, estimate the minimum air pressure that seems to be required to cause hurricane-force winds of 65 knots or higher. Discuss how confident you are in the accuracy of your estimate. 10: In your own words, describe why it's a good idea to keep your eye on the barometer. Page 3 of 3
