Your Hypothesis as a Phylogenetic Tree
advertisement
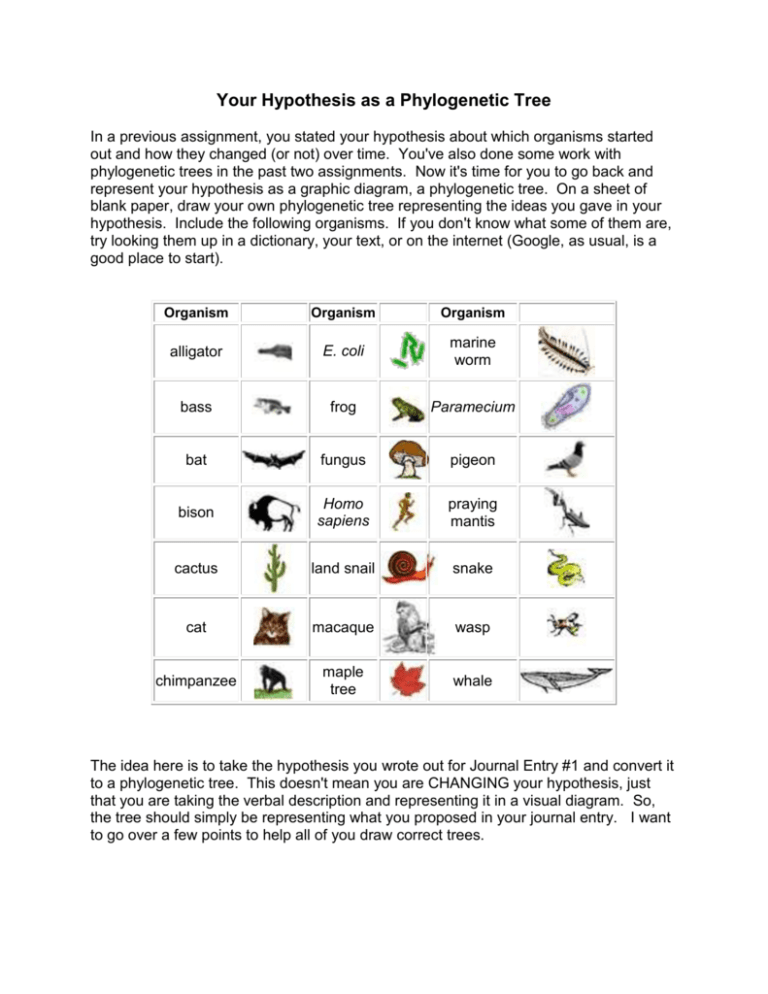
Your Hypothesis as a Phylogenetic Tree In a previous assignment, you stated your hypothesis about which organisms started out and how they changed (or not) over time. You've also done some work with phylogenetic trees in the past two assignments. Now it's time for you to go back and represent your hypothesis as a graphic diagram, a phylogenetic tree. On a sheet of blank paper, draw your own phylogenetic tree representing the ideas you gave in your hypothesis. Include the following organisms. If you don't know what some of them are, try looking them up in a dictionary, your text, or on the internet (Google, as usual, is a good place to start). Organism Organism Organism alligator E. coli marine worm bass frog Paramecium bat fungus pigeon bison Homo sapiens praying mantis cactus land snail snake cat macaque wasp chimpanzee maple tree whale The idea here is to take the hypothesis you wrote out for Journal Entry #1 and convert it to a phylogenetic tree. This doesn't mean you are CHANGING your hypothesis, just that you are taking the verbal description and representing it in a visual diagram. So, the tree should simply be representing what you proposed in your journal entry. I want to go over a few points to help all of you draw correct trees. General Tips: 1. First, your hypothesis needs to be able to account for all 21 organisms. This means that you should be including all 21 on your tree. 2. The tree should diagram what you wrote in your journal. If you wrote that E. coli gave rise to Paramecium, the tree needs to show that. Don't change the relationships in the tree; use it to show what you hypothesized in your first journal entry. The only exception to this would be if you originally said organisms arose by mating between different species -- this is rare, and only occurs in closely related organisms -- coyotes and gray wolves, but not foxes and wolves, for instance. If you said this, you should change that portion of your hypothesis. See below for more on this. 3. An easy way to start is put all the organisms across the top, grouping them by any relationships you will be drawing. All 21 of those are alive today, so all 21 had better at the top of the tree, because that's the present time. First draw them: 4. Then draw the lines: The vertical (Y) axis represents time. Now is at the top, the further back in the past, the further down the page/tree. The most ancient organism is thus the furthest back, or at the bottom of your tree. If the first organism or organisms are among the 21 represented by icons, you can put their icons at the bottom too, but you don't have to. In fact, I recommend that you do not. Just starting a line is okay, as shown above. Obviously, if your first organisms aren't among the 21, you'll just have to start with lines at the bottom. 5. A line indicates an ancestor to descendant relationship, where successive generations would be the (invisible) points that make up the line leading from the start of life at the bottom to the present day at the top. Of course, if you want an organism to start sometime later, just don't start its line all the way down at the bottom. A fork in the line indicates a lineage splitting -- in my picture above, there is a place where the early carnivores divided into two groups, one that gave rise to cats, one to dogs. Similarly for chimp and gorilla. 6. You can label the Y-axis. You don't have to, but it may help some of you get things laid out in your mind. 7. Only two organisms can branch from one point. That is, you should get a split like a "Y" with one kind of organism on one branch, a different on the other. This means that two groups of individuals from the same species got separated and one of the groups changed enough that they are no longer the same species. It wouldn't happen that three groups would all do this at precisely the same moment. Hence, this IS possible, this is NOT, but this is! There are some common mistakes (B-E) made when drawing the trees, and a few things that are okay, with explanations (F-I). The image below shows 9 examples of tree drawing, some valid, some not. I have put a key with descriptions below. DON'T DO B, C, D, or E!! A. This shows a Paramecium giving rise first to E. coli and then to Amoeba. All three are alive today -- they're extant. This is okay, and a testable hypothesis. B. This shows a Paramecium giving rise first to E. coli and Amoeba. The Paramecium is not alive today, though, according to this hypothesis. It's extinct. How do I know? It isn't represented as a branch leading to the top of the tree. What this says is that it evolved into something else, but no Paramecium line lasted to the present. You wouldn't want to do this, since Paramecium is a living organism today. C. This shows a Paramecium giving rise first to E. coli and then Amoeba. The E. coli went extinct a little less than 2 million years ago (MiYA), the other two are extant. How do I know this? The E. coli line branches off about 3 MiYA but stops a little less than 2 MiYA; this is when it became extinct. Again, E. coli is a modern organism, so you can't do this. D. This is probably impossible. It shows Amoeba and Paramecium merging to become one organism. Other than a few rare cases with plants, this just doesn't happen. E. coli is shown joining them later. Again, highly unlikely. Horses and donkeys are two species; they can mate, but the offspring are mules, and are sterile. This method of producing new species just doesn't work, except in a few instances involving VERY closely related animals, or slightly less closely related plants. Usually, with animals, such matings only work within the same genus, and not always then. On the other hand, members of a species can become so different from the rest of the species that they can no longer mate with the others and produce fertile offspring. We then say that they constitute a new species. So, diagrams like A, B, and C can happen - we've actually observed the process of new species forming in the laboratory. But the process shown in D has only been observed in a few cases with closely related organisms. E. This is a common mistake when drawing a tree. What this shows is that Paramecium evolved into Amoeba which evolved into E. coli. This says that only E. coli is alive today, the other two organisms are extinct, and of course, they actually aren't. F. This says that Paramecium is now as it always has been and that it didn't evolve into anything or evolve from anything. This is a plausible testable hypothesis. G. This shows the same thing as F. You don't need to put an icon at the bottom. Also okay. H. This shows that Paramecium just appeared on earth very recently. Also okay. I. This shows that Paramecium appeared on earth a little more than 2 MiYA. Again, this is okay. NOTE: Use only the 21 organisms listed on the first page of this assignment. Do not include the other organisms, such as amoeba, dog or gorilla, used in the examples above. Examples: Here are a few examples of properly constructed trees that represent testable hypotheses. Obviously many other properly constructed trees are possible. It is very important that you follow these directions. 1. The drawing is to be in Landscape orientation on one sheet of standard 8 ½ in. x 11 in paper. 2. Use clean white printer paper. Do not use lined notebook paper. all 21 current organisms across the top 2 your first organism(s) at the bottom 3. Your drawing must be based upon your written hypothesis in Journal Entry 1. 4. You must include all 21 organisms on our list at the top of the page. 5. You must put the organism(s) you identified as the first organism(s) at the bottom. 6. Follow the directions for drawing given in the Your Hypothesis as a Phylogenetic Tree handout. 7. Put your name on the back of the paper. Do not put your name on the front. 8. Be ready to hand in the assignment at the start of class.
