Cancer Treatment with Nanotechnology: Can nanotubes “find
advertisement
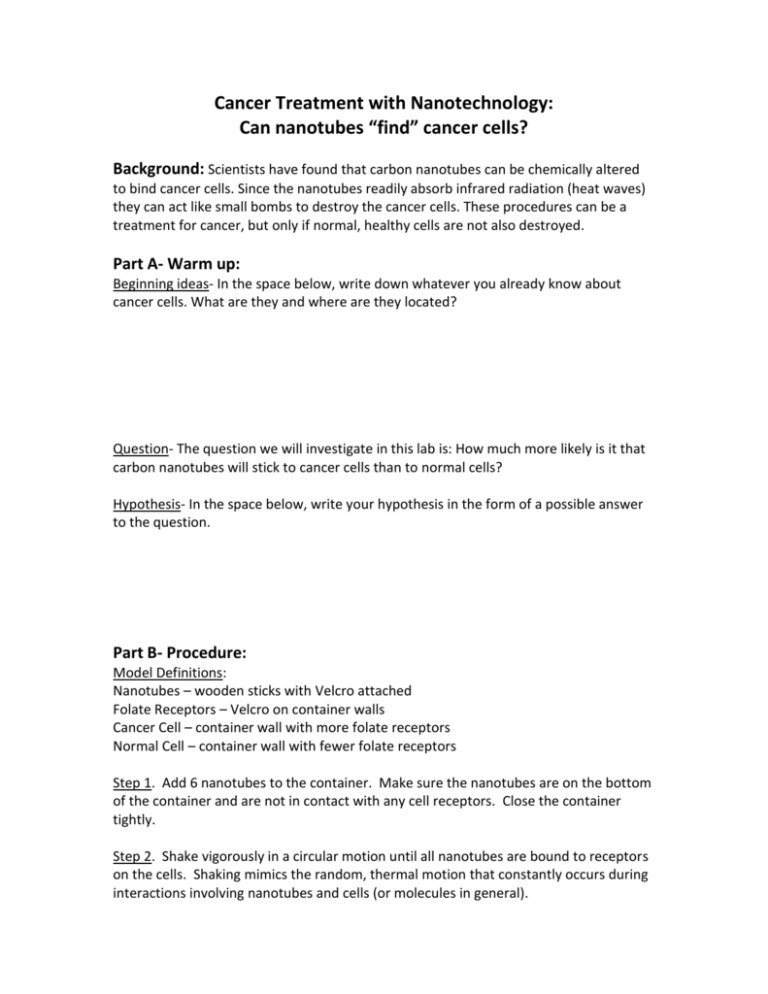
Cancer Treatment with Nanotechnology: Can nanotubes “find” cancer cells? Background: Scientists have found that carbon nanotubes can be chemically altered to bind cancer cells. Since the nanotubes readily absorb infrared radiation (heat waves) they can act like small bombs to destroy the cancer cells. These procedures can be a treatment for cancer, but only if normal, healthy cells are not also destroyed. Part A- Warm up: Beginning ideas- In the space below, write down whatever you already know about cancer cells. What are they and where are they located? Question- The question we will investigate in this lab is: How much more likely is it that carbon nanotubes will stick to cancer cells than to normal cells? Hypothesis- In the space below, write your hypothesis in the form of a possible answer to the question. Part B- Procedure: Model Definitions: Nanotubes – wooden sticks with Velcro attached Folate Receptors – Velcro on container walls Cancer Cell – container wall with more folate receptors Normal Cell – container wall with fewer folate receptors Step 1. Add 6 nanotubes to the container. Make sure the nanotubes are on the bottom of the container and are not in contact with any cell receptors. Close the container tightly. Step 2. Shake vigorously in a circular motion until all nanotubes are bound to receptors on the cells. Shaking mimics the random, thermal motion that constantly occurs during interactions involving nanotubes and cells (or molecules in general). Step 3. Count the number of nanotubes bound to the Normal Cell; this will be the number of False Positives. Count the number of nanotubes bound to the Cancer Cell; this will be the number of Positives. Record these numbers in the table provided below. Step 4. Repeat Steps 1-3 ten times. Calculate the mean value from each column, and note the maximum and minimum values from each column. Part C- Data Table: Run # False Positives (# bound to normal cell) Positives (# bound to cancer cell) 1 2 3 4 5 6 7 8 9 10 Mean Maximum Minimum Part D- Graphical Representation: Bar Graph. Draw a bar graph to represent your collected data. Use two bars: one to represent the mean number of False Positives, and one for the mean number of Positives. Mark the Minimum and Maximum values of each to show the ranges of data. Part E- Thinking: Tests- Briefly describe how you did your tests. Claim- What can I claim? Evidence- How do I know, why am I making these claims? Reflection- Why is this finding important for researchers investigating cancer treatments?
