Darla King Adly A. Girgis
advertisement

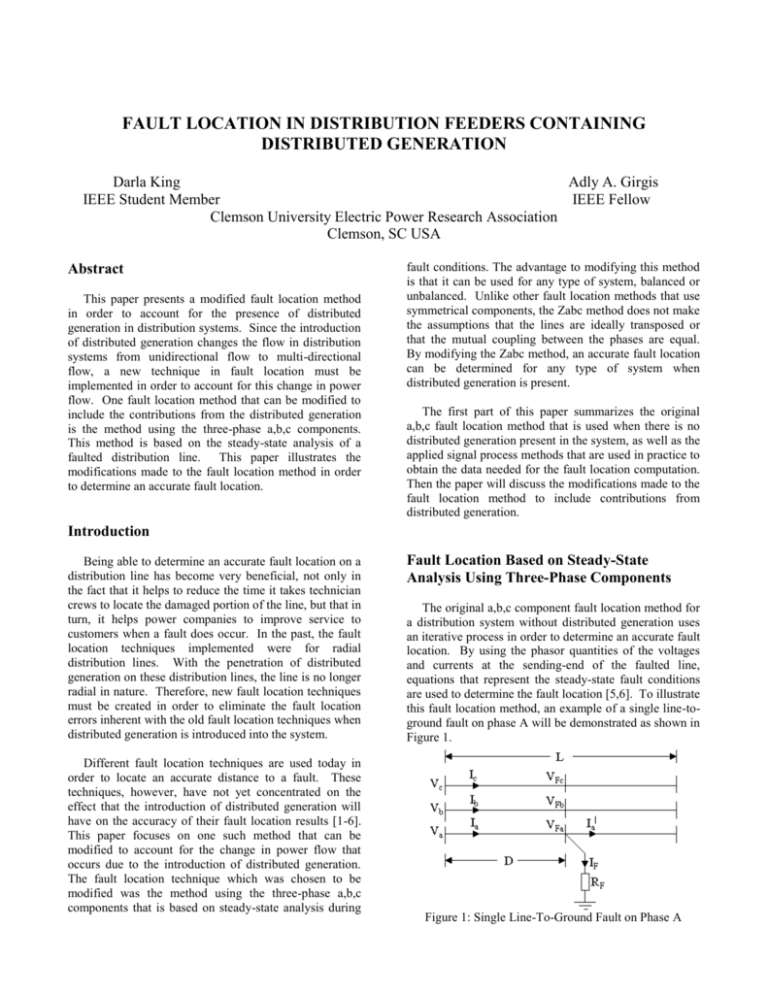
FAULT LOCATION IN DISTRIBUTION FEEDERS CONTAINING DISTRIBUTED GENERATION Darla King Adly A. Girgis IEEE Student Member IEEE Fellow Clemson University Electric Power Research Association Clemson, SC USA Abstract This paper presents a modified fault location method in order to account for the presence of distributed generation in distribution systems. Since the introduction of distributed generation changes the flow in distribution systems from unidirectional flow to multi-directional flow, a new technique in fault location must be implemented in order to account for this change in power flow. One fault location method that can be modified to include the contributions from the distributed generation is the method using the three-phase a,b,c components. This method is based on the steady-state analysis of a faulted distribution line. This paper illustrates the modifications made to the fault location method in order to determine an accurate fault location. fault conditions. The advantage to modifying this method is that it can be used for any type of system, balanced or unbalanced. Unlike other fault location methods that use symmetrical components, the Zabc method does not make the assumptions that the lines are ideally transposed or that the mutual coupling between the phases are equal. By modifying the Zabc method, an accurate fault location can be determined for any type of system when distributed generation is present. The first part of this paper summarizes the original a,b,c fault location method that is used when there is no distributed generation present in the system, as well as the applied signal process methods that are used in practice to obtain the data needed for the fault location computation. Then the paper will discuss the modifications made to the fault location method to include contributions from distributed generation. Introduction Being able to determine an accurate fault location on a distribution line has become very beneficial, not only in the fact that it helps to reduce the time it takes technician crews to locate the damaged portion of the line, but that in turn, it helps power companies to improve service to customers when a fault does occur. In the past, the fault location techniques implemented were for radial distribution lines. With the penetration of distributed generation on these distribution lines, the line is no longer radial in nature. Therefore, new fault location techniques must be created in order to eliminate the fault location errors inherent with the old fault location techniques when distributed generation is introduced into the system. Different fault location techniques are used today in order to locate an accurate distance to a fault. These techniques, however, have not yet concentrated on the effect that the introduction of distributed generation will have on the accuracy of their fault location results [1-6]. This paper focuses on one such method that can be modified to account for the change in power flow that occurs due to the introduction of distributed generation. The fault location technique which was chosen to be modified was the method using the three-phase a,b,c components that is based on steady-state analysis during Fault Location Based on Steady-State Analysis Using Three-Phase Components The original a,b,c component fault location method for a distribution system without distributed generation uses an iterative process in order to determine an accurate fault location. By using the phasor quantities of the voltages and currents at the sending-end of the faulted line, equations that represent the steady-state fault conditions are used to determine the fault location [5,6]. To illustrate this fault location method, an example of a single line-toground fault on phase A will be demonstrated as shown in Figure 1. Figure 1: Single Line-To-Ground Fault on Phase A To relate the sending-end voltages and the fault voltages, the following equation is used: Va Z aa V Z b ba Vc Z ca Z ac I a VFa Z bc D I b VFb Z cc I c VFc Z ab Z bb Z cb (1) For a single line-to-ground fault on phase A, the voltage relationship on phase A becomes: Va Z aa I a Z ab I b Z ac I c D I F RF (2) where: Zaa = self impedance on phase A in Ω/unit length Zab, Zac = mutual impedances in Ω/unit length Va = faulted phase A voltage at sending-end Ia, Ib, Ic = faulted phase currents at sending-end VF = the voltages at the fault point IF = the fault current RF = the fault resistance D = the fault distance The fault current is initially assumed to be the difference between the faulted phase current and the pre-fault phase current: IF = Ia – Ia(pre) where: Ia(pre) = the pre-fault current on phase A (3) Once the initial fault current is calculated, the initial value for the distance to the fault is determined. Equation (2) is split into real and imaginary components yielding two equations and two unknowns, the unknowns being the distance to the fault and the fault resistance. The two equations are put into matrix form and the unknown fault distance is calculated. 1 D M I F ( r ) Va ( r ) R N I V F (i ) a (i ) F (4) D Va ( r ) I F (i ) Va (i ) I F ( r ) MI F (i ) NI F ( r ) (5) where: Once the initial distance is found, an iterative process is then implemented in order to determine the accurate distance to the fault. The steps in this process are described below. (1) Using the fault distance, the fault voltages are calculated by rearranging equation (1): V Fa Va Z aa V V Z Fb b ba V Fc Vc Z ca Z ab Z bb Z cb Z ac I a Z bc D I b I c Z cc (6) (2) Next, with the newly calculated fault voltages, the remote-end current infeed is calculated by applying a radial power flow algorithm [5]. (3) Then the fault current is updated by subtracting the remote-end current infeed from the current at sending-end of faulted line on phase A: IF = Ia - Ia| (8) where: Ia| = remote-end current infeed (4) The updated fault current is then used to calculate an updated fault distance value using equation (5) (5) Once the new distance is calculated another iteration begins by going back up to step 1. The iterative process is then continuously repeated until the difference between the present distance calculated and the previously calculated distance is very small (i.e. 0.001). |Dk+1 – Dk| (9) Applied Signal Processing Digital Monitoring devices are used in power systems to record current and voltage data when a disturbance occurs. Furthermore, protective relays are deployed in every major type of equipment and attached to every circuit breaker. As microprocessor based technology continues, microprocessor based relays will include more functions: load profiling, fault oscillographic waveform capture, and metering. Some of the new microprocessor based relays include power quality and harmonic analysis. The current and voltage waveforms are sampled at 32 samples/cycle. The device includes a moving window DFT algorithm [7,8]. Other signal processing techniques include Weighted Least Squares and Kalman filtering. It should be mentioned here that the Kalman Filtering algorithm represents the optimal linear estimator [2,9]. M Raa I a ( r ) X aa I a (i ) Rab I b ( r ) X ab I b (i ) Rac I c ( r ) X ac I c (i ) N Raa I a (i ) X aa I a ( r ) Rab I b (i ) X ab I b ( r ) Rac I c (i ) X ac I c ( r ) Rxx = resistance of line impedance Xxx = reactance of line impedance (r) = real component (i) = imaginary component Modified Fault Location Method The fault location technique described previoiusly is no longer accurate once distributed generation is placed in the system. Therefore when distributed generators are introduced into the system, the fault location method must be modified in order to account for the contributions from the DG’s and to avoid large fault location errors. Once DG’s are placed in the system, the distribution feeder changes from the one seen in Figure 1 to the one seen below in Figure 2. Again, a single line-to-ground fault on phase A is used to illustrate this newly modified fault location method. equation (10). Initially the DG currents, I1a, I1b, and I1c, are assumed to be zero. VFa Va I a I a I1a V V Z L I Z D L I I (11) 1 b 1b Fb b abc 1 b abc VFc Vc I c I c I1c (3) The fault voltages are then used to solve for the DG currents on phase A by relating the voltages at the fault to the voltages at the points where the DG’s are connected, which correspond to X1 and X2 in Figure 2. To calculate the current contributions from DG1: First the sum of the sending-end current and the current from DG1 is calculated: I a I 1a V1a VFa I I Z D L 1 V V (12) 1b abc 1 Fb b 1b I c I 1c V1c VFc where: V1a ,V1b ,V1c = the voltages at DG1 (X1) From equation (12) the current contributing from DG1 is found by subtracting the currents from the sending-end from the total current feeding the fault from the left side: I1a = (Ia + I1a) – Ia (13) Figure 2: Distribution Feeder with DG’s Now the relationship between the voltages at the sendingend and the fault is: Va Ia I a I1a VFa V Z L I Z D L I I V (10) abc 1 b abc 1 b 1b Fb b Vc I c I c I1c VFc where: Z abc = 3x3 impedance matrix L1 = Distance from the source to DG1 L2 = Distance between DG1 and DG2 I1a, I1b, I1c = currents from DG1 I2a, I2b, I2c = currents from DG2 Since the current contributions from the DG’s will be initially unknown along with the actual location of the fault when a fault occurs, the DG contributions are initially neglected and an initial distance to the fault is calculated using equations (1)-(5). Then an iterative process is used to determine the accurate distance to the fault. The steps in this process are described below. (1) First the system is split into the different possible fault location sections. For the system shown in Figure 2, there are three potential sections: (i) Between the Source and DG1 (ii) Between DG1 and DG2 (iii) Past DG2 Then the section is chosen that concurs with the fault distance calculated. (2) Next, using the fault distance, the voltages at the fault are calculated by rearranging and solving To calculate the current contributions from DG2: I 2a V2 a VFa I Z L D 1 V V abc 2 Fb 2b 2b I 2c V2c VFc (14) where: V2a , V2b ,V2c = the voltages at DG2 (X2) (4) Then the fault current is updated by adding the sending-end current on phase A to the phase A DG currents found from equations (13) and (14): IF = Ia + I1a + I2a (15) (5) The updated fault current is then used to solve for the distance to the fault, using a slightly modified version of equation (5): D V1a ( r ) I F (i ) V1a (i ) I F ( r ) MI F (i ) NI F ( r ) (16) where : M Raa ITa ( r ) X aa ITa (i ) Rab ITb ( r ) X ab ITb (i ) Rac ITc ( r ) X ac ITc (i ) N Raa ITa (i ) X aa ITa ( r ) Rab ITb (i ) X ab ITb ( r ) Rac ITc (i ) X ac ITc ( r ) ITj(r) = Ij(r) + I1j(r) ITj(i) = Ij(i) + I1j(i) j = a,b, or c (6) Once the new distance is calculated another iteration begins by going back up to step 1. The iterative process is then continuously repeated until the difference between the present distance calculated and the previously calculated distance is very small (i.e. 0.001) using equation (9). This fault algorithm shows the basic steps in which to calculate an accurate fault distance when a single line-toground fault is located between DG1 and DG2 given a system as seen in Figure 2. For other types of systems and faults, some of the data needed for the equations will vary but the process will remain the same. Also an assumption that is made when using this algorithm is that the voltage and current data is measured or obtained from the sending-end of the faulted line. Unfortunately in distribution lines, this is not always the case. For most distribution lines, there are no measuring devices available at the beginning of each line segment. Measurements are usually only available at the beginning of the distribution line or substation. This assumption is a source of error in the modified fault location method. actual distance where the fault was simulated and the percent error was calculated. First to illustrate the iterative process that occurs when determining a fault location, a specific fault simulation point will be discussed. For a simulated fault between DG2 and DG3, specifically at 3.05 miles from the source, the fault location algorithm was used to determine the actual fault location based on the calculated voltage and current data previously discussed. It was seen that it took 14 iterations for the algorithm process to yield a final fault distance of 3.0426 miles. Comparing the fault distance determined by the modified fault location method and the actual simulated fault distance, the percent error was calculated to be 0.243%. A diagram showing the iterations for this example can be seen below in Figure 4. 3.11 Results and Simulations Fault Location (miles) A simple system containing a source and three distributed generators, as seen in Figure 3, was used to test the accuracy of the modified fault location method when distributed generation was in the system. A single line-to-ground fault on phase A was placed at different points along the line so that the fault occurred in all the potential fault location sections in the system. 3.1 3.09 3.08 3.07 3.06 3.05 3.04 3.03 3.02 3.01 1 2 3 4 5 6 7 8 9 10 11 12 13 14 Iteration Number (#) Figure 4: Iterative Process First a three-phase load flow was performed in order to obtain the pre-fault voltages and currents needed. Then for each of the given fault locations, three-phase fault analysis using the bus impedance matrix [10] was done to calculate, during fault conditions, the phase voltages at the source as well as at the points at which the DG’s were connected. This data represented the data that would normally be available and obtained from fault recorders or other digital recording devices in conjunction with the signal-processing algorithm. The impedance values of the source, the DG’s, and the line were known and an arbitrary value for the fault resistance was chosen. Arbitrary lengths were also chosen for the distances between the source and the three DG’s. Once all the preliminary data was calculated, the modified Zabc method was used to determine the actual distance to the fault. The distance to the fault found was then compared to the 1.8 1.6 Percent Error (%) Figure 3: Single Line Diagram For the system shown in Figure3, when all the fault distances determined from the modified fault location method for a single line-to-ground fault at various points along the line were compared to the actual distances for each of the particular simulated fault points, it was seen that the method was very accurate. The average percent error was seen to be around 1.0% with a maximum error being 1.69%. The percent error results for different fault locations can be seen below in Figure 5. 1.4 1.2 1 0.8 0.6 0.4 0.2 0 0.3 0.6 0.9 1.2 1.7 1.9 2.1 2.4 2.7 3 3.3 3.6 3.9 4.2 4.5 Fault Location (miles) Figure 5: Fault Location Method Results Conclusion The basis of this paper was to show that by modifying an already existing fault location method, this new modified fault location technique can be used to accurately determine a fault location when distributed generation is present in the system. It was seen that the results were highly accurate when using the modified fault location method. Although this paper shows that this fault location technique accurately determines a fault location, there are other factors that still need to be explored. One such factor is dealing with the errors that may occur due to the availability of fault data on distribution lines. This paper is just the first step at accounting for distributed generation in power systems when determining a fault location. Future research and study still need to be done in order to substantiate the accuracy of this modified fault location method. References [1] T. Takagi, Y. Yamakoshi, M. Uamaura, R. Kondow, T. Matushima, Development of a New Type of Fault Location Using the One-Terminal Voltage and Current Data, IEEE Transactions on Power Apparatus and Systems, Vol. PAS-101, No.8, August 1982, pp. 28922898. [2] A. A. Girgis, An Overview of Fault Location Techniques in Distribution and Transmission Systems, Proceedings of 4th MEPCON 96, pp. 51-55. [3] E.O. Schweitzer, A Review of Impedance-Based Fault Locating Experience. Presented at the 15th Annual Western Protective Relay Conference, Spokane, WA, October 1988. [4] L. Erikson, M.M. Saha, G.D. Rockefeller, An Accurate Fault Locator with Compensation for Apparent Reactance in the Fault Resistance Resulting from Remote-End Infeed, IEEE Transactions on Power Apparatus and Systems, Vol. PAS-104, No.2, February 1985, pp. 424-435. [5] J. Zhu, D. Lubkeman, A. A. Girgis, Automated Fault Location and Diagnosis on Electrical Power Distribution Feeders, IEEE Transactions on Power Delivery, Vol. 12, No. 2, April 1997,pp. 801-809. [6] E.C. Senger, C. Goldemberg, G. Manassero, Automated Fault Location System for Primary Distribution Feeders, Power Quality 2000 Proceedings, October 2000, pp. 215-221. [7] J.S. Thorp, A.G. Phadke, and S.H. Horowitz, Some Applications of Phasor Measurements to Adaptive Protection, IEEE Transactions on Power Systems, Vol. PWRS-3, No.2, May 1988, pp. 791-798 [8] D.G. Hart, W. Peterson, D. Ny, J. Schneider, D.Novosel, R. Wright, Tapping Protective Relays for Power Quality Information, IEEE Computer Applications in Power Systems, Vol. 13, No.1, 2000, pp. 45-49 [9] A.A. Girgis, Optimality of Kalman Filtering in Digital Protection of Power Systems, Proceedings of MEPCON 94, pp. 231-235 [10] E.B. Makram, M.A. Bou-Rabee, A.A. Girgis, ThreePhase Modeling of Unbalanced Distribution Systems during Open Conductors and/or Shunt Fault Conditions Using the Bus Impedance Matrix, Electric Power Systems Research, Vol. 13, No.3, December 1987, pp. 173-183. Biography Darla King obtained a B.S. degree in Electrical Engineering from Clemson University in December of 2000. She is currently pursuing a M.S. degree in Electrical Engineering with an emphasis in Power Systems at Clemson University. She is a student member of IEEE and holds the office of secretary for the Clemson Chapter of the Power Engineering Society. Adly Girgis [IEEEF’92] received his B.Sc. and M.Sc. In EE from Assiut University, Egypt and his Ph.D. in EE from Iowa State University, USA. He is presently Duke Power Distinguished Professor in power engineering and director of Clemson University Electric Power Research Association (CUEPRA) at Clemson University, Clemson, USA.


