Process Fundamentals: Diagrams & Parameters
advertisement
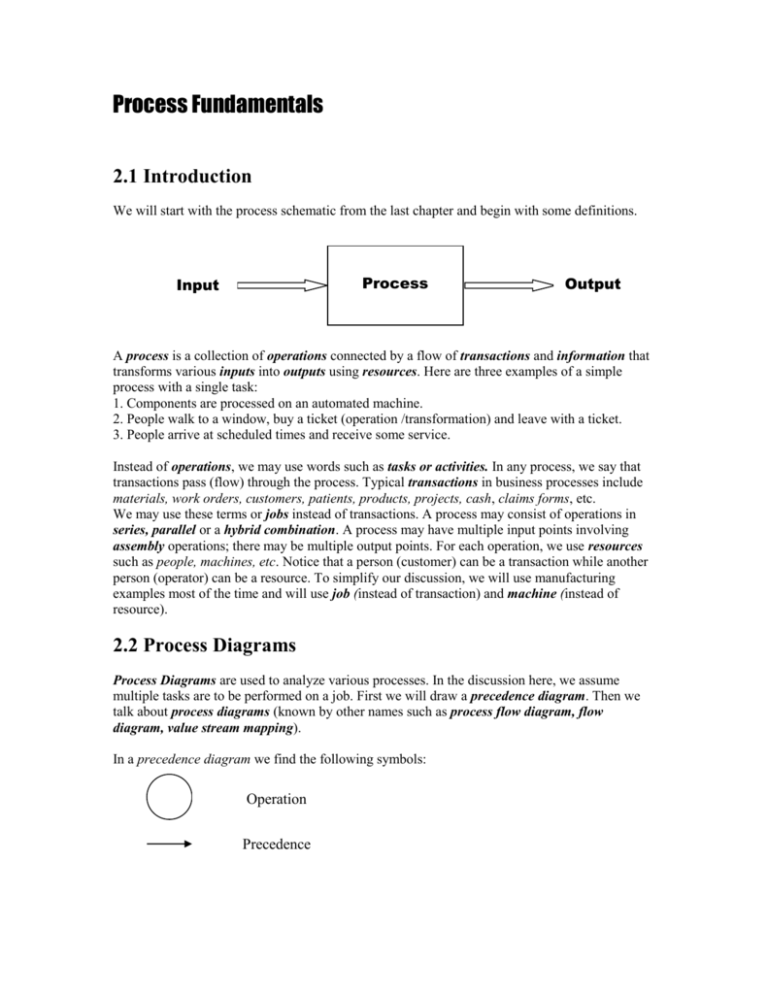
Process Fundamentals 2.1 Introduction We will start with the process schematic from the last chapter and begin with some definitions. Process Input Output A process is a collection of operations connected by a flow of transactions and information that transforms various inputs into outputs using resources. Here are three examples of a simple process with a single task: 1. Components are processed on an automated machine. 2. People walk to a window, buy a ticket (operation /transformation) and leave with a ticket. 3. People arrive at scheduled times and receive some service. Instead of operations, we may use words such as tasks or activities. In any process, we say that transactions pass (flow) through the process. Typical transactions in business processes include materials, work orders, customers, patients, products, projects, cash, claims forms, etc. We may use these terms or jobs instead of transactions. A process may consist of operations in series, parallel or a hybrid combination. A process may have multiple input points involving assembly operations; there may be multiple output points. For each operation, we use resources such as people, machines, etc. Notice that a person (customer) can be a transaction while another person (operator) can be a resource. To simplify our discussion, we will use manufacturing examples most of the time and will use job (instead of transaction) and machine (instead of resource). 2.2 Process Diagrams Process Diagrams are used to analyze various processes. In the discussion here, we assume multiple tasks are to be performed on a job. First we will draw a precedence diagram. Then we talk about process diagrams (known by other names such as process flow diagram, flow diagram, value stream mapping). In a precedence diagram we find the following symbols: Operation Precedence In a process diagram we find the following symbols: Material flow Resource at a stage Buffer / Storage Information flow Example 2.2.1: Consider a process to make a certain product X. The precedence diagram for X is given in Fig (2.1). There are 7 tasks (shown by nodes). The first number in the node indicates the task number and the second number indicates the processing time in seconds. Arrows show precedence. For example, task 4 can be performed only after completing tasks 1 and 3. When you start performing these tasks on a new product, you can either complete task 1 first or task 2. In fact you could perform tasks 2, 3 and 5 before you undertake task 1. If you add up all processing times, you will find that it takes a total of 200 seconds to complete product X. 1 : 20 4 : 40 3 : 10 2 : 50 6 : 30 5 : 30 Figure 2.1: Precedence diagram for product X 7 : 20 We will now discuss the process flow diagram for product X. (A) 1: 20 2: 50 3: 10 4: 40 5: 30 6: 30 7: 20 5: 30 6: 30 7: 20 (B) N1 4: 40 M1 2: 50 1: 20 3: 10 M2 2: 50 N2 4: 40 (C) 2: 50 1, 5: 50 3, 4: 50 6, 7: 50 Figure 2.2: Various process flow diagrams for the product X Figure (2.2) shows many ways we can set up a process for making product X. In (A), seven tasks are carried out in series in seven stages (stations or workstations). Notice that we have decided to perform operation 1 before operation 2. While making sure that the precedence relationships are satisfied. We actually cannot tell from the process flow diagram as to which operation must precede which one. In 2.2(B), we still have the same 7 stages but at stage 2 (and stage 4), we have set up two machines in parallel. One product at stage 2 may be processed on machine M1; the next may be process on M2. In 2.2(C), we have set up the process with 4 stages. At stage 1, operation 2 is performed. At stage 2, operations 1 and 5 are performed and so on. Notice that we make sure that the precedence relationships are not violated. 2.3 Process Parameters We can analyze a process through different parameters. Input rate gives the entering rate of jobs; in [Q/T] Output rate ( i.e. flow rate, production rate, throughput rate) gives the exit rate of jobs ; in [Q/T]. Capacity is the maximum output rate possible; [Q/T]. Cycle time (CT) is the reciprocal of capacity; in [T/Q]. Actual cycle time is the reciprocal of output rate; in [T/Q]. Minimum Manufacturing Lead Time (MLT) (flow time) is the fastest processing time for a transaction to go through the process, when the process is empty; in [T]. Average Manufacturing Lead Time (MLT) (flow time) is the average time required for a transaction to go through the process; in [T]. Work-In-Process (WIP) is the average (over time) number of transactions in the process; in [Q]. We will also use Gantt Charts to depict information pictorially. The horizontal axis of a Gantt chart generally represents time scale. In a machine based Gantt chart, different machines (resources) are plotted along the vertical axis and machine utilization is shown. In a job based Gantt chart, jobs (transactions) are plotted on the vertical axis to show the progress of each job. We will generally use machine-based charts. Example 2.3.1 A service involves one machine (M1) performing a single task and it takes exactly 4 minutes per task. Component “X” is processed at M1 and comes out as product Y. M1 X Y 4 We will analyze three situations: (a) A new component is scheduled every 10 minutes. (b) A new component is scheduled every 4 minutes. (c) A new component is scheduled every 3 minutes. We will assume that in each case, the first component entering the system will be called job 1, the second one job 2, and so on. Part (a): The Gantt chart is as follows: M1: idle Job1 0 4 Job2 10 14 Since each job enters the system every 10 minutes, the input rate will be 1/10 [units / min]. The output rate will be 1/10 [units / min]. The actual cycle time is 10 [min / units]. The average MLT is 4 [min]. Notice in the Gantt chart that between time units 4 to 10, the machine is idle. Part (b): We draw a Gantt chart for the situation. M1: Job1 0 Job2 Job3 4 8 Job4 12 16 Since each job enters the system every 4 minutes, the input rate is 1 / 4 [unit / min]. Job 1 will go immediately to M1. After 4 minutes, job 1 will be released from M1, Job 2 will enter the system at the same time and will go to M1. Also, the output rate will be same as the input rate, i.e. Output rate = 1 / 4 [unit / min] = 15 [units / hour]. The actual cycle time is 4 [min / units]. The average MLT is 4 [min]. Part (c): In this case we will need a buffer. Bu: 2 M1: 1 0 4 3 4 5 2 3 4 8 12 16 Since each job enters the system every three minutes, the input rate will be 1/3 [unit / min] or 20 [units / hour]. However, M1 can process jobs every 4 minutes. So the output rate will be only 1/4 [unit / min] = 15 [units / hour]. In fact, in the Gantt chart for first few jobs, we can see that some jobs need to be placed in the buffer (Bu). Job 1 goes directly to M1 at 0 and comes out at 4. Job 2 arrives in the system at time 3, stays in the buffer for 1 minute. Job 3 stays in the buffer for 3 minutes. You can see that every subsequent job stays one more minute in the buffer that the previous job and we won’t be able draw all theses jobs in the buffer. The actual cycle time is 4 [min / units]. The minimum MLT is 4 [min]. The average MLT tends to infinity as time goes to infinity. In fact, each successive transaction stays 1 minute longer and the system never becomes stable. In fact any process will not become stable if the input rate is greater than the system capacity. The average WIP also goes to infinity. Some important observations: • Output rate can never exceed capacity. • For sequential stages, the capacity is determined by the slowest stage called the bottleneck. • When machines are in parallel (performing the same operation), capacities add. Example 2.3.2 We will still consider a single stage process here, except there are several machines operating in parallel. A product can be processed on any one of the three machines in parallel (M1, M2, M3). It takes 10 seconds for processing on M1, 16 seconds on M2 and 20 seconds on M3. M1, 10 M2, 16 M3, 20 Part (a) If you need to process 1125 units per hour, do you need an extra machine? Part (b) If so, what should be the per-unit processing time on this extra machine? Part (a): We have three machines in parallel and should first find the process capacity. When machines are in parallel, the capacity is equal to sum of capacities of individual machines. Capacity of M1 = 1/10 [units / second] = 1/10 [units / second] * 3600 [sec / hour] = 360 [units / hour], Capacity of M2 = 225 [units / hour], Capacity of M3 = 180 [units / hour]. System capacity = 765 [units / hour]. We therefore need an extra machine. Part (b): Since we need the capacity of 1125, the extra machine should have the capacity of (1125 – 765) = 360 [units / hour]. Since this is same as M1, the processing time on the extra machine (say M4) should be 10 seconds. Relationship between certain process parameters In the analysis of a model called “Single server queuing model” involving arrivals based on Poisson probability distributions and exponential service times, it has been shown that when the process becomes stable, there is a relationship between process parameters. In particular, the relationship can be expressed by L = λ * W, where L is the average number of customers in the system, λ is the arrival rate and W is the average time in the system. Prof. J. D. C. Little of MIT developed the proof for this formula. This formula can be applied to a wide variety of processes in steady state and can be written as WIP = Flow time * Flow rate. We will use this Little’s formula to analyze many different situations in the next few sections. WIP represents the sum of average number of transactions occupying resources in a process. Dimension of WIP is [Q]. Flow rate is same as the output rate (also called throughput rate or production rate) and it is reciprocal of actual cycle time. Flow time is same as the average MLT (also called or throughput time). We can therefore write Little’s formula, using our terminology, as WIP = average MLT * output rate = average MLT / actual CT 2.4 Process parameter calculations We will now continue with (more complex) examples of processes. We will also make use of Little’s formula from the previous section. Example 2.4.1: A process involves two sequential tasks. Task 1 is done at Station 1 in 10 minutes and task 2 is performed at Station 2 in 8 minutes. M1, 10 M2, 8 Part (a): Determine the following: CT for station1? Cycle time for Station 1 is 10 [min. / unit] CT for station 2? Cycle time for Station 2 is 8 [min. / unit] Bottleneck Station? Station 1 Process Capacity? 1/10 [units / min.] CT for the process? Cycle time for the process is 10 [min. / unit] Minimum MLT? It will take at least 10 [min.] + 8 [min.] = 18 minutes Part (b): Consider the following schedule. Starting at time 0, one new job enters the process every 10 min. at station 1. i. Calculate the actual cycle time and the flow rate (i.e. output rate). ii. Calculate average MLT iii. Calculate WIP contribution of each resource and the total. iv. Verify Little’s formula. To begin with, we will plot the Gantt chart for this schedule. S1 1 2 S2 3 1 0 10 4 2 20 5 3 30 4 40 5 50 58 i. From the Gantt chart, a job will come out the process at time 18, 28, 38, 48, 58, …. - every 10 minutes. The actual CT = 10 [min. / unit] and the flow rate = 1/10 [units / min]. ii. The first job enters the process at 0 and comes out at 18, the second job enters the process at 10 and comes out (after 18 minutes) at 28. In fact every job will stay in the process of 18 minutes. Therefore average MLT = 18 [min.] iii. Notice from the Gantt chart that station 1 is always occupied by a job. So the contribution of station 1 to the WIP is 1.00 [units]. The process is considered to be stable after the cycle repeats itself. On station 2, if you ignore the first 10 minutes of idle time, you will notice that a job occupies the resource for 8 minutes and the resource (i.e. station 2) is idle for 2 minutes (and the cycle repeats). Therefore the WIP contribution of station 2 is 0.80 [units] and the total WIP is 1.80 [units]. iv. You can now easily verify Little's formula: WIP = MLT * Flow rate = MLT / CT Example 2.4.2 Consider example 2.4.1 again. Suppose we add another identical machine in parallel at station 1. The two machines, M1 and M2 require 10 minutes to complete the first task. At station 2, M3 requires 8 minutes. M1, 10 M3, 8 M2, 10 Thus a product will be processed on M1 and M3 or M2 and M3. A buffer (not shown) may be needed between the two stations. (a) Determine the following: CT for station 1? 5 [min. / unit]; Capacity of M1 or M2 is 6 [units / hour]; the station capacity is then 12 [units / hour]. This means that CT for station 1 is 1/12 [hours / unit] or 5 [min. / unit]. CT for station 2? 8 [min. / unit] Bottleneck? Station 2 Process Capacity? 1/8 [units / min.] = 7.5 [units / hour] CT for the process? 8 [min. / unit] Minimum MLT? 10 + 8 = 18 [min.] Since both machines at stage 1 take 10 minutes, we could send the job to any of these two machines (followed by M3). (b) Jobs are sent to M1 every 16 minutes starting at time 0 and to M2 every 16 minutes starting at time 8. Verify Little’s formula? Hint: determine WIP, then actual CT and average MLT. M1: 1 3 M2: 2 M3: 1 0 7 4 2 10 8 5 18 16 6 3 26 4 34 5 42 6 50 58 Part 1: WIP contributions: For M1: 10 / (10 + 6) = 0.625 [units] For M2: 10 / (10 + 6) = 0.625 [units] For M3: 1.00 [units] Total : 2.250 [units] Part 2: Each job stays in the system for 18 minutes, hence average MLT = 18 [min.] From the Gantt chart, each job after the first one comes out after the next one with 8-minute interval, hence actual CT = 8 [min. / unit] From Little’s formula, WIP = MLT / CT = 18 [min.] / 8 [min. / unit] = 2.25 [units]. (c) Jobs are release simultaneously to M1 and M2 every 16 minutes starting at time 0. Verify Little’s formula. Note that since two jobs will finish simultaneously at M1 and M2 and only one can be scheduled on M3, we need a buffer. Since the buffer will hold inventory, we need to consider this in WIP calculations. (Do this on your own!!!) Hint: WIP = 2.75 [units] Comments on Example 2.4.2 Notice that in both schedules (b and c), a job was introduced in the process with an average of 8minute interval, hence the input rates, and output rates were same as the system capacity. Similarly, actual cycle times for both schedules were same as the process cycle time. However, schedule 1 appears to be better than schedule 2 since it has lower MLT and lower WIP. If we do not have sufficient orders and reduce the input rate below capacity, there will be no bottleneck station and WIP contribution of each resource will be less than 1. 2.5 Process parameter calculations: assembly operations We will illustrate this part through the following example: Example 2.5.1 Product AA is processed at station 1 containing 2 machines in parallel. Product BB is processed at Station 2 then at station 3. One unit of AA and one unit of BB is picked from the buffer and assembled at station 4. The assembled product is then processed at station 5 containing three machines in parallel. All processing times are in minutes. S1 R1, 16 M1, 9 AA S4 M2, 6 P1, 4 R2, 18 R3, 18 BB X1, 3 Y1, 5 S5 S2 S3 In this example, we are not in a position to determine the WIP in a true sense because two transactions (AA and BB) are merging to form a new product. We can however find station capacities and other parameters associated with the process. Questions: (a) What is the process capacity? (b) What is the minimum MLT? Answers: (a) First we need to determine the CT for each station. CT values for station 2, 3 and 4 are 3 [min/unit], 5 [min./unit] and 4 [min./unit] respectively. CT calculations for parallel machines: Find a common multiple of processing times for the station Station 1: Common multiple = 18 minutes. In 18 minutes we can process 2 jobs on M1 and 3 jobs on M2, or a total of 5. Therefore CT for station 2 = 18/5 [min/unit] = 3.6 [min./unit], Station 5: Common multiple = 144 minutes. In this time we can process 9 jobs on R1 and 8 jobs each on R2 and R3 or a total of 25. Therefore CT for station 5 = 144/25 [min/unit] = 5.76 [min/unit]. The Bottleneck is station 5 (longest CT). Therefore, the process capacity will be [60 / 5.76] ≈ 10.4 [units / hour]. (b) Minimum MLT: One unit of AA will reach the buffer in 6 minutes (through M2) and one unit of BB will reach the buffer in 8 minutes. Thus we need at least 8 minutes before we can start the assembly at station 4. At station 5, the smallest time is 16 min. Therefore minimum MLT = 8 + 4 + 16 = 28 [minutes]. Proposition: If P1, P2, …, Pk are processing times on k machines in parallel at a station, then the station’s cycle time is given by: CT = 1 / [(1/P1) + (1/P2) + … + (1/Pk) ]. 2.8 Some insights Capacity of a process is the maximum output rate. If input rate becomes higher than the capacity, the process will not become stable. MLT for incoming jobs will become higher and higher. If we need to increase the capacity of any process, we need to add resources at the bottleneck stage. This may shift bottleneck to another stage. For two schedules it is possible to have the same cycle time (output rate) but different WIP and MLT. The lower MLT and WIP the more efficient is the process. Consider the following three simple examples: 1. Components are processed on an automated machine. 2. People walk to a window, buy a ticket (operation / transformation) and leave with a ticket. 3. People arrive at scheduled times and receive some service. In example 1, the processing times are known (and fixed). This is similar to what we have discussed up to now. We can schedule these operations at appropriate times; thus the transaction arrival time to the system is also known. When arrival times and processing times are fixed (for all practical purposes), we have a deterministic process. In example 2, arrivals may be random and processing times may vary. If arrivals and processing times behave according to some probability distributions, we have probabilistic or stochastic processes. In the third example, arrivals are deterministic while processing times may be stochastic. Analysis for nondeterministic cases can be complex, since processing times are variables, bottleneck operations can shift frequently.

