Appendix S2 - Proceedings of the Royal Society B
advertisement
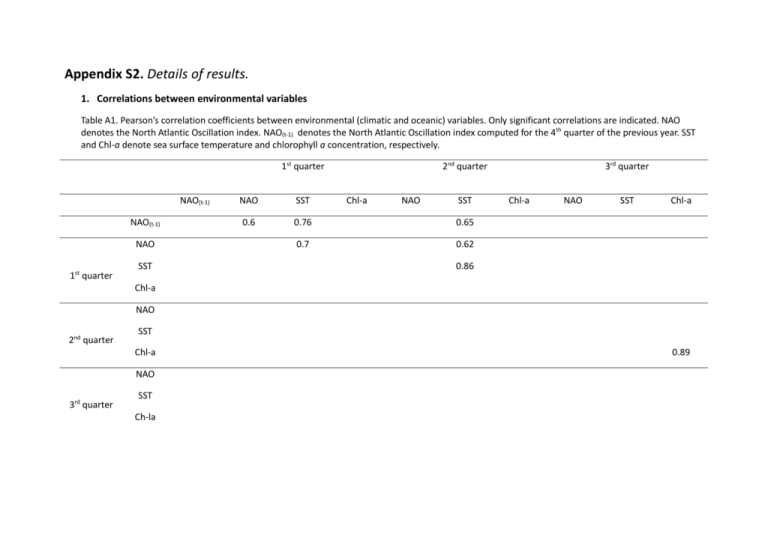
Appendix S2. Details of results. 1. Correlations between environmental variables Table A1. Pearson’s correlation coefficients between environmental (climatic and oceanic) variables. Only significant correlations are indicated. NAO denotes the North Atlantic Oscillation index. NAO(t-1) denotes the North Atlantic Oscillation index computed for the 4th quarter of the previous year. SST and Chl-a denote sea surface temperature and chlorophyll a concentration, respectively. 1st quarter NAO(t-1) NAO(t-1) NAO 1st quarter SST 2nd quarter NAO SST Chl-a NAO SST 0.6 0.76 0.65 0.7 0.62 3rd quarter Chl-a NAO SST Chl-a 0.86 Chl-a NAO 2nd quarter SST Chl-a NAO 3rd quarter SST Ch-la 0.89 2. Relationship between mate fidelity (FidMate), nest fidelity (FidNest) and breeding success (BS) Table A2. Model-averaged partial regression coefficients (β) and unconditional 95% confidence intervals (CIs) from generalized linear mixed-effects model of mate fidelity (FidMate). The fixed effects independent variable is pair breeding success (BS). Akaike weight (w) indicates relative importance of BS based on summing weights across models where BS occurs. Random effects for nest identity (variance component=0.27) and pair identity (variance component=2.52) were fitted (n=403). Coefficients are in bold where CIs do not include zero. Variable w β Lower CI Upper CI BS 0.98 1.24 0.43 2.05 Table A3. Model-averaged partial regression coefficients (β) and unconditional 95% confidence intervals (CIs) from generalized linear mixed-effects model of nest fidelity (FidNest). The fixed effects independent variable is pair breeding success (BS). Akaike weight (w) indicates relative importance of BS based on summing weights across models where BS occurs. Random effects for nest identity (variance component=0.24) and year (variance component=0.39) were fitted (n=445). Coefficients are in bold where CIs do not include zero. Variable w β Lower CI Upper CI BS 0.96 0.75 0.25 1.25 3. Relationships between nest fidelity (FidNest) and environmental predictors with separate modeling for successful and unsuccessful pairs Table A4. Model-averaged partial regression coefficients (β) and unconditional 95% confidence intervals (CIs) from generalized linear mixed-effects models of nest fidelity (FidNest) with separated analyses for unsuccessful (n=) and successful (n=) pairs. Fixed effects independent variables of the model set are the Sea Surface Temperature computed for the 2nd quarter of the year (SST(q2)) and Chlorophyll a concentration computed for the 2nd and 3rd quarters (Chl-a(q2) and Chl-a(q3)). Akaike weight (w) indicates relative importance of a given covariate based on summing weights across models where the covariate occurs. Coefficients are in bold where CIs do not include zero. Unsuccessful pairs Successful pairs Variable w β Lower CI Upper CI w β Lower CI Upper CI Chl-a(q3) 0.53 -29.2 -71 12 0.92 -58.3 -89 -27 Chl-a(q2) 0.41 4.5 -3 11 0.33 -3.09 -13.8 7.9 SST(q2) 0.38 -0.5 -1.5 0.53 0.37 -0.77 -2.3 0.82 BSmean 0.28 -1.2 -6.6 4.2 0.28 -2.1 -10 5.8 4. Relationships between nest fidelity (FidNest), breeding success (BS) and three univariate predictors of BS (A) 2nd quarter North Atlantic Oscillation index (NAO) Table A5. Model-averaged partial regression coefficients (β) and unconditional 95% confidence intervals (CIs) from generalized linear mixed-effects models of mate fidelity (Fidmate, n=403) and nest fidelity (FidNest, n=445). Fixed effects independent variables of the model set are the pair breeding success (BS), the NAO index (2nd quarter) and their interaction. Akaike weight (w) indicates relative importance of a given covariate based on summing weights across models where the covariate occurs. Coefficients are in bold where CIs do not include zero. Fidmate FidNest Variable w β Lower CI Upper CI w β Lower CI Upper CI BS 0.99 1.22 0.39 2.04 0.99 0.64 0.098 1.17 NAO 0.36 0.16 -0.48 0.81 0.86 -0.08 -0.84 0.68 BS×NAO 0.1 0.14 -1.19 1.47 0.76 -1.21 -2.23 -0.18 (B) 2nd quarter chlorophyll a concentration (Chl-a) Table A6. Model-averaged partial regression coefficients (β) and unconditional 95% confidence intervals (CIs) from generalized linear mixed-effects models of mate fidelity (Fidmate, n=403) and nest fidelity (FidNest, n=445). Fixed effects independent variables of the model set are the pair breeding success (BS), the chlorophyll a concentration (2nd quarter, Chl-a) and their interaction. Akaike weight (w) indicates relative importance of a given covariate based on summing weights across models where the covariate occurs. Coefficients are in bold where CIs do not include zero. Fidmate FidNest Variable w β Lower CI Upper CI w β Lower CI Upper CI BS 0.07 0.82 -1.72 3.36 1.0 3.19 0.94 5.44 Chl-a 0.97 12.52 -3.48 28.5 1.0 -0.36 -5.73 4.99 BS×Chl-a 0.02 6.49 -6.97 19.95 0.94 -8.22 -14.1 -2.27 (C) 3rd quarter chlorophyll a concentration (Chl-a) Table A7. Model-averaged partial regression coefficients (β) and unconditional 95% confidence intervals (CIs) from generalized linear mixed-effects models of mate fidelity (Fidmate, n=403) and nest fidelity (FidNest, n=445). Fixed effects independent variables of the model set are the pair breeding success (BS), the chlorophyll a concentration (3rd quarter, Chl-a) and their interaction. Akaike weight (w) indicates relative importance of a given covariate based on summing weights across models where the covariate occurs. Coefficients are in bold where CIs do not include zero. Fidmate FidNest Variable w β Lower CI Upper CI w β Lower CI Upper CI BS 0.01 -0.73 -10.5 9.02 0.99 3.95 -0.89 8.80 Chl-a 1.0 160.5 -9.73 330.6 1.0 -21.5 -50.9 7.91 BS×Chl-a 0.0 69.2 -71.7 210.2 0.76 -39.4 -76.8 -2.03 5. Comparison of models with various random effects structures Table A8. AICc of generalized linear mixed-effects models of breeding success (BS) for various model structures (Year: year factor; IDpair: pair identity; IDnest: nest identity). Random effects Degrees of freedom AICc IDpair 3 953.9381 Year + IDpair + IDnest 4 955.9021 IDnest 2 959.1305 Year + IDnest 3 961.0354 IDpair 2 979.4369 Year + IDpair 3 981.364 Year 2 992.3991 (none) 1 994.2423
