Data Sheet V.A1.27 HI27 - IUPAC Task Group on Atmospheric
advertisement
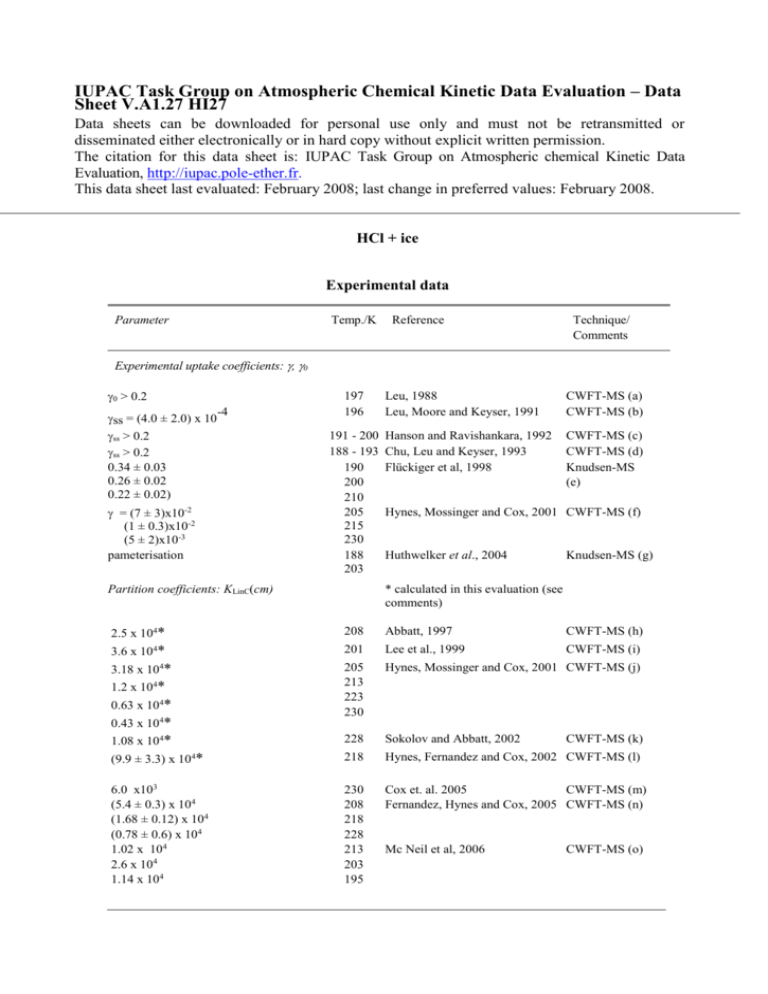
IUPAC Task Group on Atmospheric Chemical Kinetic Data Evaluation – Data Sheet V.A1.27 HI27 Data sheets can be downloaded for personal use only and must not be retransmitted or disseminated either electronically or in hard copy without explicit written permission. The citation for this data sheet is: IUPAC Task Group on Atmospheric chemical Kinetic Data Evaluation, http://iupac.pole-ether.fr. This data sheet last evaluated: February 2008; last change in preferred values: February 2008. HCl + ice Experimental data Parameter Temp./K Reference Technique/ Comments Experimental uptake coefficients: , 0 0 > 0.2 ss = (4.0 ± 2.0) x 10 ss > 0.2 ss > 0.2 0.34 ± 0.03 0.26 ± 0.02 0.22 ± 0.02) -4 = (7 ± 3)x10-2 (1 ± 0.3)x10-2 (5 ± 2)x10-3 pameterisation 197 196 191 - 200 188 - 193 190 200 210 205 215 230 188 203 Partition coefficients: KLinC(cm) Leu, 1988 Leu, Moore and Keyser, 1991 CWFT-MS (a) CWFT-MS (b) Hanson and Ravishankara, 1992 Chu, Leu and Keyser, 1993 Flückiger et al, 1998 CWFT-MS (c) CWFT-MS (d) Knudsen-MS (e) Hynes, Mossinger and Cox, 2001 CWFT-MS (f) Huthwelker et al., 2004 Knudsen-MS (g) * calculated in this evaluation (see comments) 2.5 x 104* 208 Abbatt, 1997 CWFT-MS (h) * 3.18 x 104* 1.2 x 104* 0.63 x 104* 0.43 x 104* 1.08 x 104* 201 Lee et al., 1999 CWFT-MS (i) 205 213 223 230 Hynes, Mossinger and Cox, 2001 CWFT-MS (j) 228 Sokolov and Abbatt, 2002 218 Hynes, Fernandez and Cox, 2002 CWFT-MS (l) 230 208 218 228 213 203 195 Cox et. al. 2005 CWFT-MS (m) Fernandez, Hynes and Cox, 2005 CWFT-MS (n) 3.6 x 10 4 (9.9 ± 3.3) x 10 * 4 6.0 x10³ (5.4 ± 0.3) x 104 (1.68 ± 0.12) x 104 (0.78 ± 0.6) x 104 1.02 x 10⁴ 2.6 x 10⁴ 1.14 x 10⁴ Mc Neil et al, 2006 CWFT-MS (k) CWFT-MS (o) Comments (a) Fast flow tube reactor with MS detection. Ice condensed from the vapor phase onto the cold flow tube. corrected for gas diffusion using estimated diffusion coefficients. The amount taken up by ice increased with pHCl and decreasing temperature, and with ice thickness. (b) Flow tube reactor with MS detection. Ice was condensed from the vapor phase onto the cold wall of the flow tube, and corrected for diffusion using estimated diffusion coefficients scaled to 197 K. (c) Ice-coated flow tube with MS using ion-counting detection. The substrates were prepared by condensing H2O-HNO3 at 196 K resulting in a NAT film of thickness 70 µm. The surface areas and bulk densities of condensed films were determined. The reported data were corrected for gas diffusion (important for large values of ) as well as for pore diffusion (important for small -2 -4 values of ) using a two-site surface reaction model; pHCl ~10 mbar to 10 mbar range. (d) Ice-coated flow tube with CIMS detection. Significant corrections for diffusion were made using calculated diffusion coefficients for the reactants in He. At low HCl concentrations (10 10 -3 molecule cm ) rapid saturation of the pure ice surface is observed within one minute and 12 -3 decreases from 0.3 to <0.01. At high HCl concentrations (2 x 10 molecule cm ) there was unlimited uptake at > 0.3 due to formation of a new phase. (e) Knudsen cell reactor with MS detection. Both transient supersaturation (pulsed valve) as well -7 as steady-state experiments were performed with pHCl in the range of 6.7 x 10 mbar to 2.7 x 10 4 - mbar, respectively. values were obtained at HCl doses leading to a quasi-liquid layer of HCl-H2O on the surface. (f) Uptake experiment using a fast flow reactor at 2.3 – 2.7 mbar He equipped with electron-impact quadrupole mass spectrometry. The uptake coefficient has a negative temperature dependence. The calculated coverage of HCl on ice is only weakly dependent on temperature and pressure PHCl in the range (0.5 – 2.7)x10-6 mbar. It leads to an average saturation coverage of HCl on ice of (2.0 ± 0.7)x1014 molecules cm-2 at 205K using the geometric surface area. (g) Uptake experiment in a Knudsen flow reactor on typical time scales of 30 minutes or so. The emphasis is placed on the measurement of the total amount of HCl, NHCl, taken up in the partial pressure range 4 x10⁻⁸ to 2.3x10⁻⁵ mbar. NHCl is divided into a diffusive and a non-diffusive component, with the former becoming important at later times, typically after the first 300s of uptake. The diffusive component has a t05 dependence and is proportional to pHCl-05. A parametrization scheme of NHCl is proposed as a function of time, temperature, HCl acidity constant on ice, Henry’s law constant for physical solubility of HCl and the diffusion constant of HCl in the diffusion layer. (h) Coated wall flow tube study of HNO3 uptake on frozen-film ice surface using MS detection. Surface coverages determined from integrated uptake prior to saturation. Data for surface coverage of HCl reported for conditions where adsorption partially reversible and close to saturation. HCl surface coverage was 2.5 x 10¹⁴ molecule cm-2 at PHCl = 1.3 x 10⁻⁶ Torr (6.03 x 10¹⁰ molecule cm-3 at 208 K). Partition coefficient calculated in this evaluation using 1-site Langmuir model assuming maximum surface coverage of 3 x 10¹⁴ molecule cm-2. (i) HCl uptake on frozen-film and vapour deposited ice surface at 201 K, using MS detection. P HCl = (0.1 – 3.0) x 10-6 Torr. Adsorption of HCl partially reversible, but continuous uptake observed when PHCl increased above 2 x 10⁻⁶ Torr, postulated to be due to HCl induced melting of surface film. Larger uptakes were observed on vapour deposited ice, assumed to be due to ‘rough’ surface. HCl surface coverage was (1.1 ± 0.6) x 1014 molecule cm-2 at PHCl = (1 to 15) x 10-7 Torr (4.8 to 72 x 109 molecule cm-3 at 201 K). Cited upper limit partition coefficient calculated in this evaluation using 1-site Langmuir model assuming maximum surface coverage of 3 x 10¹⁴ molecule cm-2. (j) HCl uptake on frozen-film ice surface using MS detection. PHCl = (0.5 – 3.0) x 10-6 Torr and T = 205 – 235 K. Surface coverages determined from integrated uptake prior to saturation. Adsorption of HCl was partially reversible and close to saturation in this pressure range since coverage increased only weakly with increased PHCl . HCl surface coverage declined from (2.0 ± 0.7) x 1014 molecule cm-2to (1.3 ± 0.7) x 1014 molecule cm-2 at PHCl = 1.1 x 10⁻⁶ Torr over Temperature range. Mean partition coefficients over this range calculated in this evaluation using 1-site Langmuir model assuming maximum surface coverage of 3 x 10¹⁴ molecule cm -2. Partition coefficients cited by authors were obtained using analysis with a 2-site Langmuir model were much lower and did not reproduce the T dependence of . (k) Study of competetive uptake of HNO3 and HCl on frozen-film ice surface using MS detection. In simultaneous adsorption, HCl adsorbs less strongly than HNO3 (estimated KHNO3/KHCl = 2 ± 1). In absence of HNO3, HCl surface coverage was (1.3 ± 0.2) x 1014 molecule cm-2 at PHCl = 0.5 x 10⁻⁶ Torr (2.1 x 10¹⁰ molecule cm-3 at 228 K). Partition coefficient calculated in this evaluation using 1-site Langmuir model assuming maximum surface coverage of 3 x 10¹⁴ molecule cm-2. (l) Study of competetive uptake of HNO3 and HCl on frozen-film ice surface at 218 K using same system as in Comment (j). In the presence of HNO3 HCl adsorbs less strongly than on bare ice and is completely reversible. On bare ice, HCl surface coverage was (1.3 ± 0.2) x 1014 molecule cm-2 at PHCl = (0.4 to 2.0) x 10-6 Torr ((1.8 to 8.8) x 1010 molecule cm-3 at 218 K). Mean partition coefficient over this range in this evaluation using 1-site Langmuir model assuming maximum surface coverage of 3 x 10¹⁴ molecule cm-2. (m) Model of gas flow and surface exchange in CWFT with a single site Langmuir mechanism The model was used to reanalyse experimental results from Hynes et al (see comment (l)). The experimental time-dependent uptake profiles were best fitted with an additional process involving diffusion of the adsorbed molecules into the ice film. The model allowed true surface coverages to be distinguished from total uptake including transfer to the bulk. The reported Langmuir constant, Keq, was obtained by fitting uptake profiles close to saturation, PHCl = 1.3 x 10⁻⁶ Torr (4.8 x 10¹⁰ molecule cm-3 at 230 K), with a diffusion term included. (n) Flow tube study at 2.3 mbar He using MS detection. Coadsorption of HCl and HNO3 on frozen film ice at 208 - 228K. The surface was doped with a constant pHNO3 (1.0 x10⁻⁶ Torr) and HCl uptake saturated after typically 200s and was completely reversible. The surface coverage increased with pHCl ((0.2 to 3.6) x10-6 Torr) up to a maximum of 3 x 10¹⁴ molecule cm-2 at both 218 K and 228 K. Partition coefficients cited were determined using 1-site, 2-component Langmuir model fit to experimental data, using partition coefficients for HNO3 fixed at the values given in Cox et al (2005) (see note (m)), which are adopted in this evaluation. (o) Study of interaction of HCl on zone-refined solid ice tube, frozen film ice, and vapour deposited ice at 186 - 243K, using ellipsometry to monitor ice surface and CIMS detection of gas uptake. HCl induces disordered region (i.e. quasi-liquid layer) ~ 100nm thick near the ice/HCl-hydrate phase boundary, leading to diffusion of surface HCl into bulk ice; in ‘core ‘ of ice stability region uptake is reversible, although evidence for 2 different binding sites on films. Cited data obtained by Langmuir model fit in this region. Preferred Values Parameter αs Nmax / molecule cm-2 KLinC / cm Value 0.3 3 x 10¹⁴ 0.0219 exp(2858/T) T/K 190 - 210 190 - 230 205 - 230 Reliability log (αs) (KLinC) / cm (E/R) /K ± 0.3 ± 0.2 ± 920 190 - 210 205 - 230 Comments on Preferred Values There have been many experimental studies of HCl – ice interaction but most earlier studies were at temperatures < 200 K and concentrations corresponding to stability regions of the phase diagram for either hydrate or supercooled HCl/H2O solutions. Under these conditions uptake is continuous and irreversible, especially at high pHCl. At higher temperatures in the ‘ice stability’ region, uptake rate is time dependent, declining from an initial rapid uptake ( ~ 0.1) to very slow uptake when the surface is saturated at a surface coverage, of about 3.0 1014 molecules cm-2 on smooth ice films; adsorption is partially reversible and can be described quite well using a Langmuir model. The slow uptake has been shown to be diffusive in character (Huthwelker et al, 2004; Cox et al, 2005) and to increase in rate near the boundary of the ice stability region. Recent ellipsometric observations of ice films exposed to HCl (McNeil et al, 2006) show that surface melting to form a quasi-liquid layer up to 100nm thick results from adsorption of HCl in this region, which is consistent with the observed uptake behaviour. The Langmuir ultimately model fails under these conditions, and uptakes in excess of 1 ML are achieved at high pHCl.. Surface coverages at low pHCl on ice films in the temperature range 200-240 K have been reported in a number of CWFT studies (Abbatt, 1997; Lee et al, 1999; Hynes et al., 1999 and 2002; Sokolov and Abbatt, 2002; and Fernandez et al., 2005). There is reasonable agreement in the measured uptakes. For example, a gas-phase concentration of 2 to 6 1010 molecule cm-3 of HCl results in sub-monolayer equilibrium surface coverages (N) of (1.3±0.2) 1014 molecules cm-2 for a temperature of 228 K (Hynes et al, 1999; Sokolov and Abbatt, 2002), of 2.0 1014 molecules cm-2 at 218 K (Fernandez et al., 2002), and 2.5 1014 molecules cm-2 at 208 K(Abbatt, 1997). All studies report a weak dependence of on pHCl, but none of the studies investigated pHCl dependence of uptake in the unsaturated region of the Langmuir isotherm. Values of the maximum surface coverage, Nmax~ 3 1014 molecule cm-2, reported by Hynes et al, (1999, 2002), and Lee et al, (1999) are consistent with values for other traces gases on similar ice surfaces, and with molecular dynamics calculations (Abbatt, 2003). Hynes et al used a 2-site model to derive Langmuir equilibrium constants from data close to saturation, but the evidence for 2-site kinetics is not compelling. Fernandez et al. (2005), McNeil et al, (2006) and Cox et al, (2005) report Langmuir partition coefficents using a 1-site model. For this evaluation we have calculated KLangC values from reported surface coverages, using the full form of the single site Langmuir isotherm ( = [HCl]ads/Nmax = [HCl]gKLangC/( 1 + [HCl]gKLangC) and assuming maximum surface coverage, Nmax~ 3 1014 molecule cm-2, independent of temperature. Average pHCl were taken when a range was reported. The values of KLangC plotted in Van’t Hoff form give the temperature dependence of KLangC, which with Nmax gives the recommended KlinC values for calculation of surface coverages at concentrations up to ~1 x 10⁻⁶ hPa in the given temperature range. At lower temperatures and higher pressures, corresponding either to hydrate or surfaces with a quasi-liquid layer, uptake can be continuous with no surface saturation. Diffusion rate of adsorbed molecules into the bulk can be approximated using (Dt)1/2/L with D = 1 x 10-12 cm2s-1 and L=100 nm as used by Cox et al. (2005). Measurements of the uptake coefficient are problematic in CWFT experiments, due to the difficulty in separating adsorption and desorption kinetics and to diffusion limitations, which will result in determination of a lower limit. Knudsen cell measurements of o indicate a surface accomodation coefficient of ~0.3 at T < 200 K. At higher temperatures decreases with time as increasing amounts of HCl are adsorbed in the ice film, and measurements in the ice-stability region are affected by this. The recommended values for o is based on the measurements of Fluckiger et al (1998). References Abbatt, J. P. D.: Geophys. Res. Lett. 24, 1479 1997. Abbatt, J. P. D.: Chem. Rev., 103, 4783, 2003. Cox, R. A., Fernandez, M.A., Symington, A., Ullerstam, M. and Abbatt, J.P.D.: Phys.Chem.Chem.Phys, 7, 3434, 2005. Chu, L.T., Leu, M.-T. and Keyser, L.F.: J. Phys. Chem. 97, 7779, 1993. Fernandez, M. A., Hynes, R. G., and Cox, R. A.: J. Phys. Chem. A, 109, 9986 2005. Flückiger, B., Thielmann, A., Gutzwiller, L. and Rossi, M.J.: Ber. Bunsenges. Phys. Chem. 102, 915, 1998. Huthwelker, Th, Malmström, M.E., Helleis, F., Moortgat, G.K. and Peter, Th.: J. Phys. Chem. A, 108, 6302, 2004. Hanson, D.R. and Ravishankara, A.R.: J. Phys. Chem. 96, 2682, 1992. Hynes, R.G., Mössinger, J. and Cox, R.A.: Geophys. Res. Lett. 28, 2827, 2001. Hynes, R. G., Fernandez, M. A. and Cox, R. A.: J. Geophys. Res. 107, 4797 2002, doi:10.1029/2001JD001557. Lee, S-H., Leard, D. C., Zhang, R., Molina, L.T., and Molina, M. J., Chem.Phys.Lett., 315, 7, 1999. Leu, M.-T.: Geophys. Res. Lett. 15, 17, 1988. Leu, M.-T., Moore, S.B. and Keyser, L.F.: J. Phys. Chem. 95, 7763, 1991. McNeill, V.F, Studies of heterogeneous ice chemistry relevant to the atmosphere, PhD Thesis, Massechusetts Ins. Technol., 2005 (http://hdl.handle.net/1721.1/28841) McNeill, V. F., Loerting, Th., Geiger, F.M., Trout, B.L., and Molina, M. J., Proc.Nat.Acad.Sci.(US), 103, 9422, (2006). Sokolov, O., and J. P. D. Abbatt , Geophys. Res. Lett. 29, 1851, 2002. y = m 1 + m 2* M0 Value HCl+ice; 201 - 230 K Error m1 -37.148 2.1154 m2 2857.8 458.6 Chisq 3.2819 NA R 0.82661 NA -20 y = -37.148 + 2857.8x R= 0.82661 -22 ) -1 molecule -24 3 /cm eq -26 ln (K Hynes etal 2001 Abbatt 1997 Sokolov & Abbatt 2002 Hynes et al 2002 Lee et al 1999 McNeill 2004 Fernandez et al 2005 Cox et al 2005 ln(Keq)/cm3molec -28 -30 0.004 0.0045 0.005 1/T/K 0.0055
