Femtosecond spectral-temporal characterisation of optoelectronic
advertisement

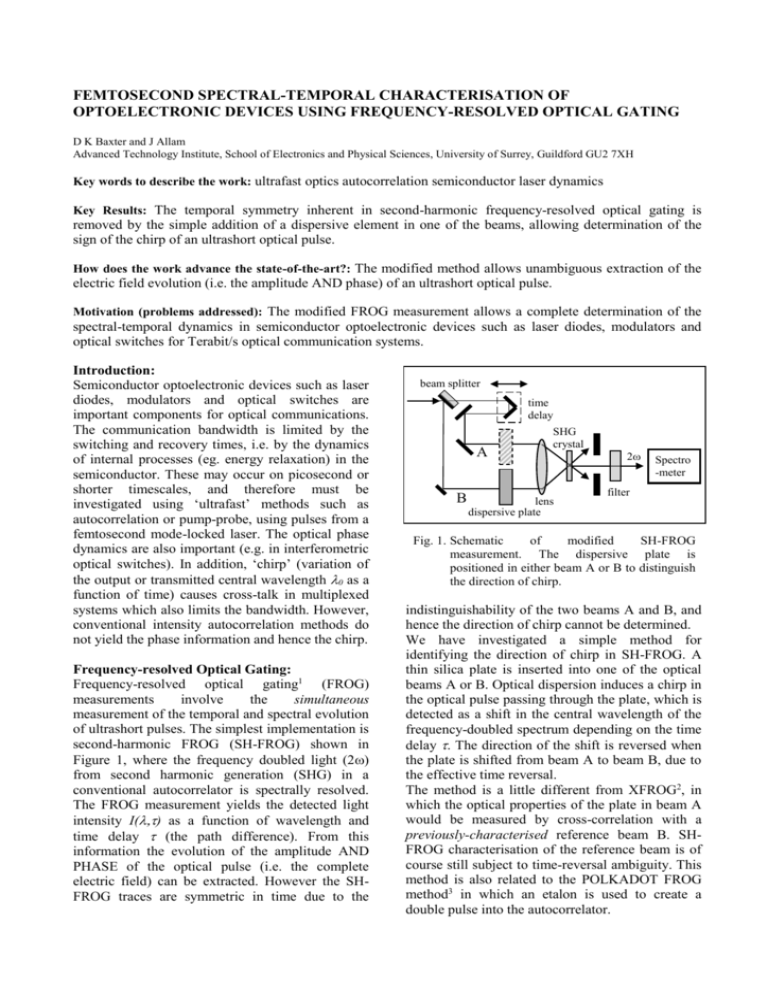
FEMTOSECOND SPECTRAL-TEMPORAL CHARACTERISATION OF OPTOELECTRONIC DEVICES USING FREQUENCY-RESOLVED OPTICAL GATING D K Baxter and J Allam Advanced Technology Institute, School of Electronics and Physical Sciences, University of Surrey, Guildford GU2 7XH Key words to describe the work: ultrafast optics autocorrelation semiconductor laser dynamics Key Results: The temporal symmetry inherent in second-harmonic frequency-resolved optical gating is removed by the simple addition of a dispersive element in one of the beams, allowing determination of the sign of the chirp of an ultrashort optical pulse. How does the work advance the state-of-the-art?: The modified method allows unambiguous extraction of the electric field evolution (i.e. the amplitude AND phase) of an ultrashort optical pulse. Motivation (problems addressed): The modified FROG measurement allows a complete determination of the spectral-temporal dynamics in semiconductor optoelectronic devices such as laser diodes, modulators and optical switches for Terabit/s optical communication systems. Introduction: Semiconductor optoelectronic devices such as laser diodes, modulators and optical switches are important components for optical communications. The communication bandwidth is limited by the switching and recovery times, i.e. by the dynamics of internal processes (eg. energy relaxation) in the semiconductor. These may occur on picosecond or shorter timescales, and therefore must be investigated using ‘ultrafast’ methods such as autocorrelation or pump-probe, using pulses from a femtosecond mode-locked laser. The optical phase dynamics are also important (e.g. in interferometric optical switches). In addition, ‘chirp’ (variation of the output or transmitted central wavelength 0 as a function of time) causes cross-talk in multiplexed systems which also limits the bandwidth. However, conventional intensity autocorrelation methods do not yield the phase information and hence the chirp. Frequency-resolved Optical Gating: Frequency-resolved optical gating1 (FROG) measurements involve the simultaneous measurement of the temporal and spectral evolution of ultrashort pulses. The simplest implementation is second-harmonic FROG (SH-FROG) shown in Figure 1, where the frequency doubled light (2) from second harmonic generation (SHG) in a conventional autocorrelator is spectrally resolved. The FROG measurement yields the detected light intensity I() as a function of wavelength and time delay (the path difference). From this information the evolution of the amplitude AND PHASE of the optical pulse (i.e. the complete electric field) can be extracted. However the SHFROG traces are symmetric in time due to the beam splitter time delay A B SHG crystal lens dispersive plate 2 Spectro -meter filter Fig. 1. Schematic of modified SH-FROG measurement. The dispersive plate is positioned in either beam A or B to distinguish the direction of chirp. indistinguishability of the two beams A and B, and hence the direction of chirp cannot be determined. We have investigated a simple method for identifying the direction of chirp in SH-FROG. A thin silica plate is inserted into one of the optical beams A or B. Optical dispersion induces a chirp in the optical pulse passing through the plate, which is detected as a shift in the central wavelength of the frequency-doubled spectrum depending on the time delay . The direction of the shift is reversed when the plate is shifted from beam A to beam B, due to the effective time reversal. The method is a little different from XFROG2, in which the optical properties of the plate in beam A would be measured by cross-correlation with a previously-characterised reference beam B. SHFROG characterisation of the reference beam is of course still subject to time-reversal ambiguity. This method is also related to the POLKADOT FROG method3 in which an etalon is used to create a double pulse into the autocorrelator. Experimental results: The FROG trace of a ~80fs optical pulse with a centre wavelength of 780nm from a SpectraPhysics Tsunami laser is shown in Fig. 2(a). The false colour indicates the detected intensity I(). The autocorrelation width is 120 fs and the spectral width is 4.7nm. A small tilt in the I() trace indicates chirp in beam A resulting from optical dispersion induced by the beamsplitter (~8.5mm path length). (a) (b) dispersion prism-pair ahead of the autocorrelator. Removal of the dispersive plate then induces a known chirp as in 2(c). The plate also serves to calibrate the time axis of the autocorrelator. Future work: We are interested in the spectral-temporal dynamics of semiconductor optoelectronic devices such as laser diodes, optical amplifiers, and modulators. Of particular interest are devices working at 1.3μm and 1.5μm made of new materials such as quantum dots, and “dilute nitride” semiconductors. beam splitter time delay 2 nm SHG crystal A O1 S 100 fs (c) (d) 2 O2 lens time Fig. 2. FROG traces (second harmonic light intensity as a function of wavelength and time delay) with different locations of dispersive plate. (a) no plate, (b) plate located ahead of initial beamsplitter, (c) plate in beam A, (d) plate in beam B. Fig. 2(b) shows the FROG trace when a 13mm thick silica plate is located ahead of the beamsplitter. The pulse is slightly broadened (autocorrelation width = 142 fs) by dispersion (wavelength-dependent velocity of light). However the tilt is unchanged. When the dispersive plate is located in either beam A or B alone, the autocorrelation width is ~130fs, intermediate between the above two cases. Fig. 2(c) shows the FROG trace when the dispersive plate is in beam A. The dispersion adds to that caused by the beam splitter and the tilt (chirping of pulse in beam A) is visibly enhanced. On the other hand, when the plate is located in beam B, the dispersion in both beams becomes almost identical, and the tilt is diminished. A modified FROG extraction algorithm would allow the extraction of the electric field of the optical pulse without ambiguity in the time axis. Matching the dispersion in the plate to that in the beam splitter would allow their effect to be simultaneously cancelled using a negative- Spec. B filter Fig. 3. Schematic of XFROG (spectrally-resolved cross-correlation) measurement. Microscope objectives O1 and O2 focus (and subsequently recollimate) the light into a sample S, such as a semiconductor laser diode. An XFROG apparatus has been constructed (Fig. 3) in which one (weaker) beam A is focussed onto the facet of a waveguide device using a microscope objective. The propagated pulse is recollimated by a second objective before being focussed onto the nonlinear SHG crystal. A time-delayed strong reference pulse is spatially- and temporallyoverlapped to generate a cross-correlation signal at 2. A similar method has been used4 to observe pulse propagation effects in a semiconductor optical amplifier. Intensity cross-correlation measurements of pulse propagation in laser diodes5 revealed interesting phenomena including longlived ‘dark pulses’. The spectrally-resolved measurements should give useful information on the origin of such effects. References: 1. R. Trebino, D. J. Kane: J. Opt. Soc. Amer. A, 10, 1101 (1993) 2. S. Linden, H. Giessen, J. Kuhl: Phys. Stat. Sol. B 206, 119 (1998) 3. E. Zeek, A. P. Shreenath, P. O’Shea, M.Kimmel, R. Trebino: Appl. Phys. B 74, 265 (2002) 4. F. Romstad, P. Borri, W. Langbein, J. Mørk, J. M. Hvam: IEEE Phot. Tech. Lett. 12, 1674 (2000) 5. M. Krauer, A. P. Heberle, J. J. Baumberg, J. R. A. Cleaver: Appl. Phys. Lett. 75, 1626 (1998)


