Lens Data - La Salle University
advertisement
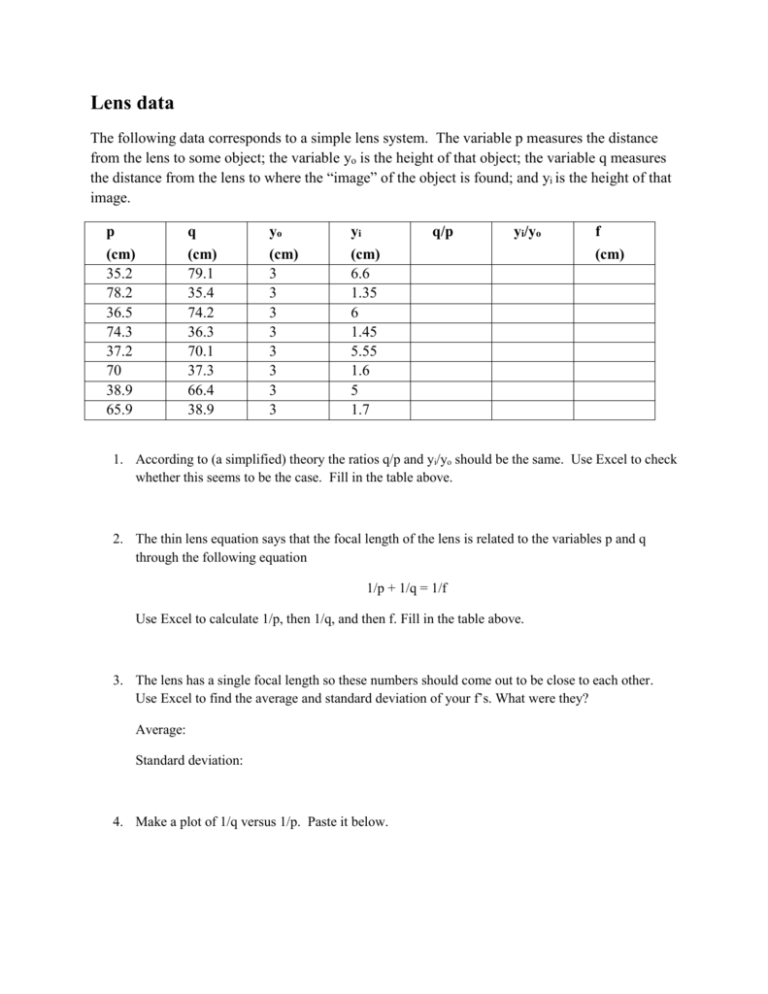
Lens data The following data corresponds to a simple lens system. The variable p measures the distance from the lens to some object; the variable yo is the height of that object; the variable q measures the distance from the lens to where the “image” of the object is found; and yi is the height of that image. p q yo yi q/p (cm) 35.2 78.2 36.5 74.3 37.2 70 38.9 65.9 (cm) 79.1 35.4 74.2 36.3 70.1 37.3 66.4 38.9 (cm) 3 3 3 3 3 3 3 3 (cm) 6.6 1.35 6 1.45 5.55 1.6 5 1.7 yi/yo f (cm) 1. According to (a simplified) theory the ratios q/p and yi/yo should be the same. Use Excel to check whether this seems to be the case. Fill in the table above. 2. The thin lens equation says that the focal length of the lens is related to the variables p and q through the following equation 1/p + 1/q = 1/f Use Excel to calculate 1/p, then 1/q, and then f. Fill in the table above. 3. The lens has a single focal length so these numbers should come out to be close to each other. Use Excel to find the average and standard deviation of your f’s. What were they? Average: Standard deviation: 4. Make a plot of 1/q versus 1/p. Paste it below. 5. What is your slope? And according to the equation above, what should your slope be. (Solve the equation above for 1/q – when comparing XY-Scatter graphs to mathematical equations, you should solve for the variable on your y axis.) 6. What was your y-intercept? According to the equation above and your previous results, what should it be?


