Steps in cost analysis
advertisement
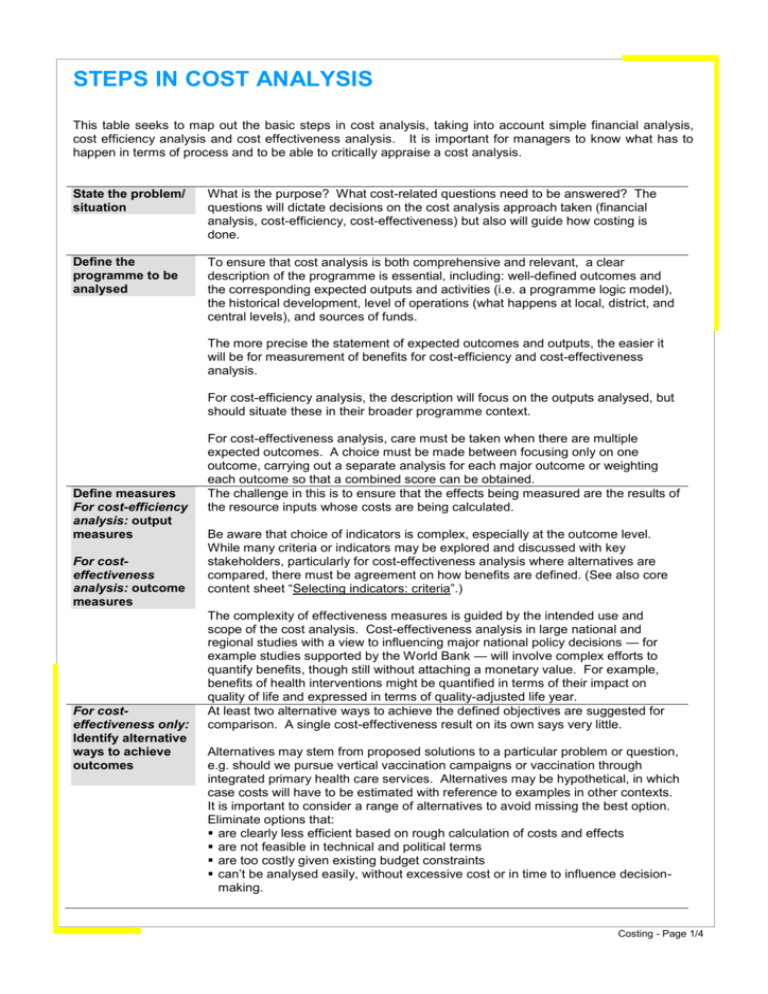
STEPS IN COST ANALYSIS This table seeks to map out the basic steps in cost analysis, taking into account simple financial analysis, cost efficiency analysis and cost effectiveness analysis. It is important for managers to know what has to happen in terms of process and to be able to critically appraise a cost analysis. State the problem/ situation What is the purpose? What cost-related questions need to be answered? The questions will dictate decisions on the cost analysis approach taken (financial analysis, cost-efficiency, cost-effectiveness) but also will guide how costing is done. Define the programme to be analysed To ensure that cost analysis is both comprehensive and relevant, a clear description of the programme is essential, including: well-defined outcomes and the corresponding expected outputs and activities (i.e. a programme logic model), the historical development, level of operations (what happens at local, district, and central levels), and sources of funds. The more precise the statement of expected outcomes and outputs, the easier it will be for measurement of benefits for cost-efficiency and cost-effectiveness analysis. For cost-efficiency analysis, the description will focus on the outputs analysed, but should situate these in their broader programme context. Define measures For cost-efficiency analysis: output measures For costeffectiveness analysis: outcome measures For costeffectiveness only: Identify alternative ways to achieve outcomes For cost-effectiveness analysis, care must be taken when there are multiple expected outcomes. A choice must be made between focusing only on one outcome, carrying out a separate analysis for each major outcome or weighting each outcome so that a combined score can be obtained. The challenge in this is to ensure that the effects being measured are the results of the resource inputs whose costs are being calculated. Be aware that choice of indicators is complex, especially at the outcome level. While many criteria or indicators may be explored and discussed with key stakeholders, particularly for cost-effectiveness analysis where alternatives are compared, there must be agreement on how benefits are defined. (See also core content sheet “Selecting indicators: criteria”.) The complexity of effectiveness measures is guided by the intended use and scope of the cost analysis. Cost-effectiveness analysis in large national and regional studies with a view to influencing major national policy decisions — for example studies supported by the World Bank — will involve complex efforts to quantify benefits, though still without attaching a monetary value. For example, benefits of health interventions might be quantified in terms of their impact on quality of life and expressed in terms of quality-adjusted life year. At least two alternative ways to achieve the defined objectives are suggested for comparison. A single cost-effectiveness result on its own says very little. Alternatives may stem from proposed solutions to a particular problem or question, e.g. should we pursue vertical vaccination campaigns or vaccination through integrated primary health care services. Alternatives may be hypothetical, in which case costs will have to be estimated with reference to examples in other contexts. It is important to consider a range of alternatives to avoid missing the best option. Eliminate options that: are clearly less efficient based on rough calculation of costs and effects are not feasible in technical and political terms are too costly given existing budget constraints can’t be analysed easily, without excessive cost or in time to influence decisionmaking. Costing - Page 1/4 Develop a costing framework The categories used for cost analysis should flow from the questions you are trying to analyse. A combination of categories is usually used. These may include: Input types (recurrent costs and capital costs) Source of funding (foreign, national, etc.) Level of operation (field and headquarters) Activities — one way of categorising within activities is to distinguish primary activities (i.e. front-line contact with primary stakeholders), secondary (i.e. providing technical support to primary), and ancillary activities (i.e. general support to programme). If the programme model described above links activities to outputs and outcomes, and cost can be assigned to specific activities, it is then possible to do costefficiency and cost-effectiveness analysis. Identify and measure costs This entails defining and measuring financial and economic costs and can be broken down into four sub-steps, the latter three dealing with economic costs. Assess and draw from available financial data. This may require reconciling more than one set of accounting records. It also requires reconciling data from different organisations that may handle costing issues differently. Budget records will reveal at least financial recurrent costs. They may not provide appropriate data for calculating capital costs (accounts register purchases, and do not track use). They might exclude important off-budget recurrent costs, e.g. donations or for personnel things like subsidised transportation and housing. Calculate the annual value of capital goods. Equipment, vehicles, and buildings can be purchased in one year and “consumed” or used over several. Their annual value, including depreciation, should be taken into account. Calculate the value of off-budget recurrent costs. Costing should include resources used by the programme but not paid for, such as voluntary work and in-kind donations. They have zero financial value but do have an opportunity cost. This is an important area for taking into account costs to primary stakeholders. Allocate shared costs. Accounting data may not disaggregate all data to the activity or even programme level. Major capital costs – vehicles, buildings, large expensive equipment – may be shared across activities and programmes. Calculating how much of the total cost to allocate to the activity or programme requires either direct measures of use (observation or journals) or indirect measures, e.g. the cost of personnel management services might be based on the percentage of staff used by the activity or programme. How this data is collected will include the obvious review of financial records at central levels with partner organisations, but also often at different levels of programme operation. It may also include observation of different stages of the programme at different operation levels, interviews, focus groups, surveys. In cost-effectiveness analysis, this is done for each alternative. The cost and effectiveness measures must be linked for each alternative studied; use consistent categories for costing. Identify and measure benefits For cost-efficiency analysis this refers to the outputs. For cost-effectiveness analysis, it requires measuring the effectiveness of each alternative. … Costing - Page 2/4 Summary calculations With the data collected, it is then possible to build cost profiles for the different activities and programmes analysed. For both cost-efficiency and cost-effectiveness analysis, calculations will include establishing the unit/cost per benefit (be it output or outcome). It is important to also identify the “marginal costs” (defined as the change in total cost resulting from the production of one more unit of output or outcome). If a programme doubles the results, the costs are not necessarily doubled. Economies of scale may allow more users for decreasing cost per user. Calculating marginal costs allows us to take this into account. Good analysis will also explore the significance of assumptions about some variables, the exact values of which are uncertain. These variables can be related to either costs or effectiveness. Cost analysis will have required defining a plausible range of values for that variable and then making a best estimate. Testing should involve exploring the effect on final calculations if that estimate is doubled or halved. A report should indicate which assumptions and corresponding estimated values have a significant effect on the final calculations and conclusions. Further analysis Having established basic conclusions about unit/cost, the next step is to explore what is responsible for the differences among alternatives studied. Following are some of the issues that should be explored: In examining the cost profiles, which input categories are significantly different (in percentage of the total cost)? What explains those differences and what relation does this bare on results achieved? For example, consider prices paid for inputs, staff ratios, staff productivity, degree of use of a facility. What if anything can be done to lower these costs? Analysis should also explore economies of scale (cost savings due to larger capacity of facility), and economies of scope (cost savings from the use of one facility for a greater diversity of services). What would happen to costs if the activities or programmes were scaled up or down, or piggy-backed with other services? Some care must be taken in this analysis, as changes in results might not be neatly calculated. It is also important to analyse the different conditions under which alternatives were operating, i.e., geography, population distribution, and other variables. Do any of these help to explain the differences in cost effectiveness? For example, providing water services may be necessarily more costly in one region than another due to terrain, depth of aquifers, etc. Try to identify the key stages in the transformation process for the programme. At which stages do the differences between the alternatives become obvious? For example, what best explains the differences in cost effectiveness of different sanitation technologies: the differences in the functioning, frequency of use, or quality of use of the sanitation alternatives? This might point to areas for change in programming. In cost-analysis of humanitarian action, additional considerations include: The need for speed must also be factored into analysis. Needs can be urgent for immediate delivery of goods to save lives and higher costs can be justified (Hallam, 1996:19). Costing - Page 3/4 PITFALLS AND TRAPS Is the scope of cost analysis cost-effective? Invest the greatest effort into finding (and using) information on the bigger costs. In a more detailed cost-effectiveness analysis this means focusing on the largest input categories instead of smaller, less important categories; e.g. on smaller categories, use simple rules of thumb, like assuming building operating costs to be equal to a certain small percentage of their annual capital (space) costs. Having limited cost analysis resources may mean analysing only the highest cost aspects of a programme or sector effort; e.g. in a humanitarian response, focusing on supply delivery for food programmes. Is data collection efficient? Collect cost information at the highest level at which it is available (if of reasonable quality) to minimise time and expense. Is there double counting? Double counting the same elements (inputs) is especially risky when obtaining data at more than one level; for example, staffing or salary figures at the delivery unit and higher levels will likely overlap. Is the use of market prices appropriate? Many goods are likely to be regularly traded in markets at well-known and predictable prices and they can usually be valued at their market prices. However, market costs do not always reflect “real” costs. Adjustments may be necessary, for example, where shortages or difficulties in the supply chain might increase the costs. Market costs themselves may vary considerably by region (e.g. housing and transportation costs) and it may be necessary to distinguish this in data collection and calculations. From whose perspective are costs calculated? Market costs may not reflect ‘real’ costs to all stakeholders. The market value of a day labourer’s time may not reflect the opportunity cost in terms of lost opportunity in other livelihood activities. One person’s cost might even be another person’s benefit. Is quality of inputs taken into consideration? Since the quality of inputs may be related to prices, it is important to ensure that a constant level of quality is compared across interventions. In principle, best practice standards, can assist in controlling for quality differences in the analysis. How solid are indirect measures? Some costs might require indirect, complicated and somewhat subjective calculations. Previous studies estimating values for these can provide guidance. It is important to establish how significant the assumptions on these indirect measures are to the final conclusions. (See above, under “Further analysis”) Sources: Brenzel, L. (1993); Hallam (1996); Kee, 1997:470; Phillips, M. and Huff-Rousselle, M. (2001); Rossi, P. H., Freeman, H. E. & Lipsey M. W. (1999); Thompson, M. S. (1980); Valadez J. and Bamberger M. (1994). Costing - Page 4/4


