Raport on NMR study of complex between β
advertisement
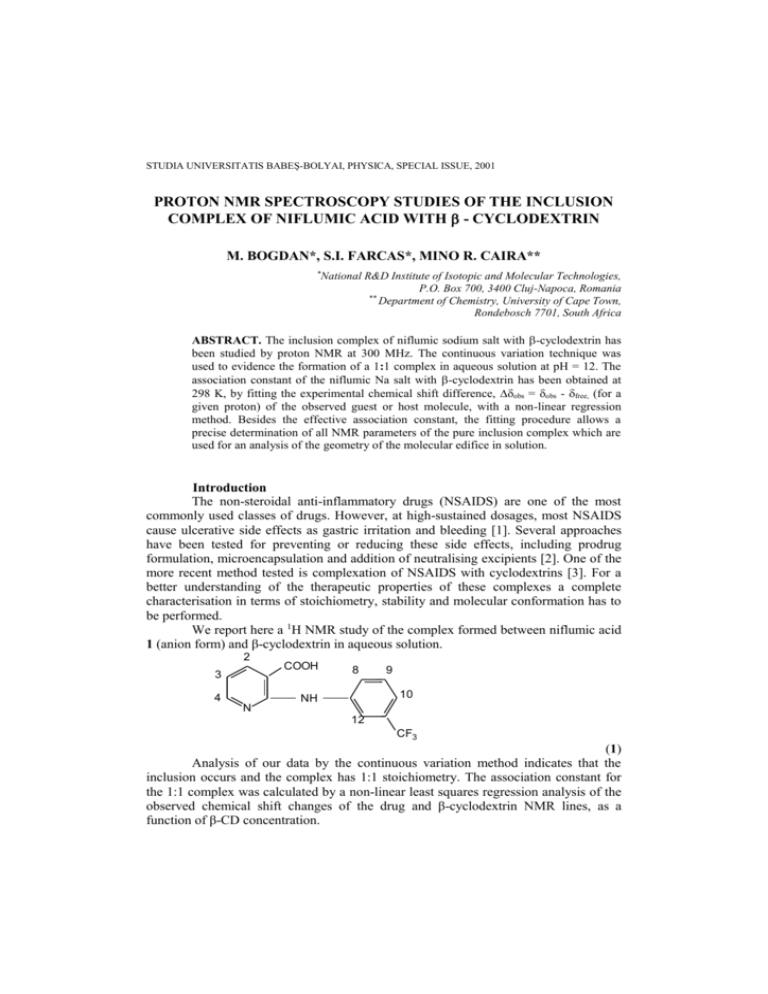
STUDIA UNIVERSITATIS BABEŞ-BOLYAI, PHYSICA, SPECIAL ISSUE, 2001 PROTON NMR SPECTROSCOPY STUDIES OF THE INCLUSION COMPLEX OF NIFLUMIC ACID WITH - CYCLODEXTRIN M. BOGDAN*, S.I. FARCAS*, MINO R. CAIRA** *National R&D Institute of Isotopic and Molecular Technologies, P.O. Box 700, 3400 Cluj-Napoca, Romania ** Department of Chemistry, University of Cape Town, Rondebosch 7701, South Africa ABSTRACT. The inclusion complex of niflumic sodium salt with -cyclodextrin has been studied by proton NMR at 300 MHz. The continuous variation technique was used to evidence the formation of a 1:1 complex in aqueous solution at pH = 12. The association constant of the niflumic Na salt with -cyclodextrin has been obtained at 298 K, by fitting the experimental chemical shift difference, obs = obs - free, (for a given proton) of the observed guest or host molecule, with a non-linear regression method. Besides the effective association constant, the fitting procedure allows a precise determination of all NMR parameters of the pure inclusion complex which are used for an analysis of the geometry of the molecular edifice in solution. Introduction The non-steroidal anti-inflammatory drugs (NSAIDS) are one of the most commonly used classes of drugs. However, at high-sustained dosages, most NSAIDS cause ulcerative side effects as gastric irritation and bleeding [1]. Several approaches have been tested for preventing or reducing these side effects, including prodrug formulation, microencapsulation and addition of neutralising excipients [2]. One of the more recent method tested is complexation of NSAIDS with cyclodextrins [3]. For a better understanding of the therapeutic properties of these complexes a complete characterisation in terms of stoichiometry, stability and molecular conformation has to be performed. We report here a 1H NMR study of the complex formed between niflumic acid 1 (anion form) and β-cyclodextrin in aqueous solution. 2 3 4 N COOH 8 9 10 NH 12 CF3 (1) Analysis of our data by the continuous variation method indicates that the inclusion occurs and the complex has 1:1 stoichiometry. The association constant for the 1:1 complex was calculated by a non-linear least squares regression analysis of the observed chemical shift changes of the drug and β-cyclodextrin NMR lines, as a function of β-CD concentration. M. BOGDAN, S.I. FARCAS, MINO R. CAIRA Materials and Methods β-CD (water content 8 mol/mol) was purchased from Sigma Chemie GmbH (Germany), D2O (deuterium content 99.7 %) from Institute of Cryogenics and Isotope Separations (Rm. Vâlcea, Romania) and niflumic acid was kindly donated by the Chem. Department, University Cape Town, South Africa (Prof. Mino Caira). Proton NMR spectra were performed at 300 MHz using a Varian Gemini spectrometer. The NMR spectra were recorded in D2O solution at 298 0.5 K and all chemical shifts were measured relative to external TMS. Typical conditions were as follows: 32 K data points; sweep width 4500 Hz giving a digital resolution of 0.28 Hz/point. The pulse width was 5 μs (450) and the spectra were collected by co-addition of 32 or 64 scans. Due to extremely low solubility of the niflumic acid in water, this was converted to sodium salt by titration with NaOD in D2O to a final pH = 12 (uncorrected meter reading). At this pH value the niflumic acid was practically completely ionised and two stock solution (both 10 mm) of sodium niflumate and β-CD were prepared in D2O. The stoichiometry of the complex was determined by the continuous variation method. The overall concentration of the two species was kept constant ([H] + [G] = M = 10 mM) and the ratio r [H] was varied form 0 to 1. This was accomplished by [ H ] [G ] using the equimolar solutions of H and G and mixing them to constant volume to the desired ratio r. [H] and [G] are the total concentrations of the host and guest respectively. X (X) The quantity obs [X] where X = H or G was plotted against r. obs is the difference between the chemical shift of free X and the observed value for a given ratio r. For determination of association constant (K), the same set of samples as that for the determination of stoichiometry was used. The data were evaluated according to eq. (1): 1/ 2 2 X 1 1 obs M M 4HG C K K 2X X In eq. (1), C represents the chemical shift difference (for a given proton) X between thefree molecule and the pure complex. Inclusion of niflumic anion is shown by the change in the chemical shift of some of the guest and host protons in comparison with the chemical shifts of the same protons in the free compounds. Partial 300 MHz 1H NMR spectra of the pure compounds and of niflumic-βCD complex are displayed in Figures 1 and 2. Distinct peaks are not observed for a bound and a free form, indicating that complexation is a dynamic process, the included niflumate undergoing rapid exchange (on the NMR time scale) between the free and bound state. 320 PROTON NMR SPECTROSCOPY STUDIES OF THE INCLUSION COMPLEX … B 8.2 8.0 7.8 7.6 7.4 7.2 7.0 A 8.2 8.0 7.8 7.6 7.4 7.2 7.0 6.8 PPM Fig. 1. Partial 300 MHz 1H NMR spectra of (A) 10 mM Na niflumate and (B) 5 mM Na niflumate and 5 mM -CD 321 M. BOGDAN, S.I. FARCAS, MINO R. CAIRA B 3.98 3.92 3.86 3.80 3.74 3.68 3.62 3.56 3.50 A 4.05 4.00 3.95 3.90 3.85 3.80 3.75 3.70 3.65 3.60 3.55 PPM Fig. 2. Partial 300 MHz 1H NMR spectra of (A) 10 mM -CD and (B) 5 mM -CD and 5 mM Na niflumate Only the spectral region for protons H-2 to H-6 of -CD is displayed 322 PROTON NMR SPECTROSCOPY STUDIES OF THE INCLUSION COMPLEX … To establish the stoichiometry of the complex, the continuos variation method was used to follow the changes in chemical shifts of protons H-5, H-3, and H-6 of βCD (Figure3) and protons 9, 10 and 12 of the ninflumate anion (Figure 4) which shows the most marked variations. Although the shape of the curves in Figures 3 and 4 are not highly symmetrical, the maximum does not deviate significantly from r = 0.5, indicating the existence of a 1:1 stoichiometry within the range of concentrations investigated. On max the other hand, the changes in chemical shifts of protons H-3 ( obs = 0.133 ppm) and H5 ( obs = 0.131 ppm) of β-CD do not conclusively indicate which side of the β-CD cavity is involved in complex formation, because no significant differences were detected. The signals of the included niflumate are shifted by complexation to a variable extent. The piridine ring protons experiences very little perturbation. Conversely, the phenyl ring protons are strongly affected by the formation of the inclusion complex. The chemical shift difference for the protons belonging to phenyl ring are higher than that for piridine ring by a factor of 10. These results clearly support the assumption that the niflumate anion is entering with the trifluoromethylphenyl residue in the β-CD cavity. max 0.6 H-6 H-3 H-5 0.5 obs[ - CD] 0.4 0.3 0.2 0.1 0.0 0.0 0.2 0.4 0.6 0.8 1.0 r Fig. 3. Job plot for H-3, H-5 and H-6 protons of -CD in the presence of different concentrations of niflumic acid anion. The association constant K was evaluated form the observed differences in chemical shifts for niflumate (9, 10 and 12) and β-CD (H-3, H-5 and H-6) protons, based on eq. (1). This equation involves no approximations and correlates the total concentrations 323 M. BOGDAN, S.I. FARCAS, MINO R. CAIRA X of the guest and host molecules with the observed difference in chemical shift, obs . We developed a computer programme written in C++ based on an iteration procedure following X specific algoritms in order to fit the experimental values of obs to the appropriate equation. Each iteration sets up a quadratic programme to determine the direction of search and the loss function (Y2, defined as the sum of the squared derivation about the predicted values), until the search converges. The programme is producing one single K value for the (X) whole process and a set of calculated C values. The programme is quite flexible since both the guest and host can be observed for spectroscopic perturbations as a function of variable guest or host concentrations. The overall K obtained from this procedure was 336 M-1 at 298 K, with Y2 = 1.38 · 10-3 and the correlation factor r = 0.9992. The complete set of chemical shifts in the free state and pure complex are reported in Table 1. 1.2 12 10 9 1.0 obs [NIF] 0.8 0.6 0.4 0.2 0.0 324 0.0 0.2 0.4 0.6 0.8 1.0 r Fig. 4. Job plots for protons 9,10 and 12 of niflumic acid anion (NIF) in the presence of different concentrations of -CD. PROTON NMR SPECTROSCOPY STUDIES OF THE INCLUSION COMPLEX … Table 1. Chemical shifts (ppm) of the niflumic acid anion and β - cyclodextrin protons in the free and complex states (c = c - free). Proton free c c 7.412 7.248 8.279 -0.148 -0.438 0.302 4.199 4.090 4.019 0.192 0.183 0.0981 Niflumic acid anion 2 3 4 8 9 10 12 8.182 (dd) 6.948 (dd) 8.246 (dd) 7.429 (d) 7.560 (t) 7.685 (d) 7.977 (s) H1 H2 H3 H4 H5 H6 5.111 3.690 4.007 3.624 3.907 3.921 β - Cyclodextrin Conclusions Analysis of our data by the continuous variation method indicates that the inclusion occurs and the complex has 1:1 stoichiometry. The association constant K for the inclusion complex was evaluated from the observed differences in chemical shifts for niflumate and β-CD protons. Unfortunately not conclusive indication concerning which side of the β-CD cavity is involved in complex formation. The results clearly support the assumption that the niflumate anion is entering with trifluoromethylphenyl residue in the β-CD cavity. R E FER EN CE S [1] T. Loftsson, B.J. Olafsdottir, H. Fridriksdottir, S. Jonsdottir, Eur. J. Pharm. Sci., 1, 95 (1993). [2] J.R. Nixon, M.S. Harris "Development of Drugs and Modern Medicines" J.W. Gorrod, G.G. Gibson and M. Mitchard Eds. Ellis Harwood, UK, 19. [3] T. Irie, K. Uekama, J. Pharm. Sci., 86, 147 (1997). 325
