Enzyme Concentration Lab
advertisement
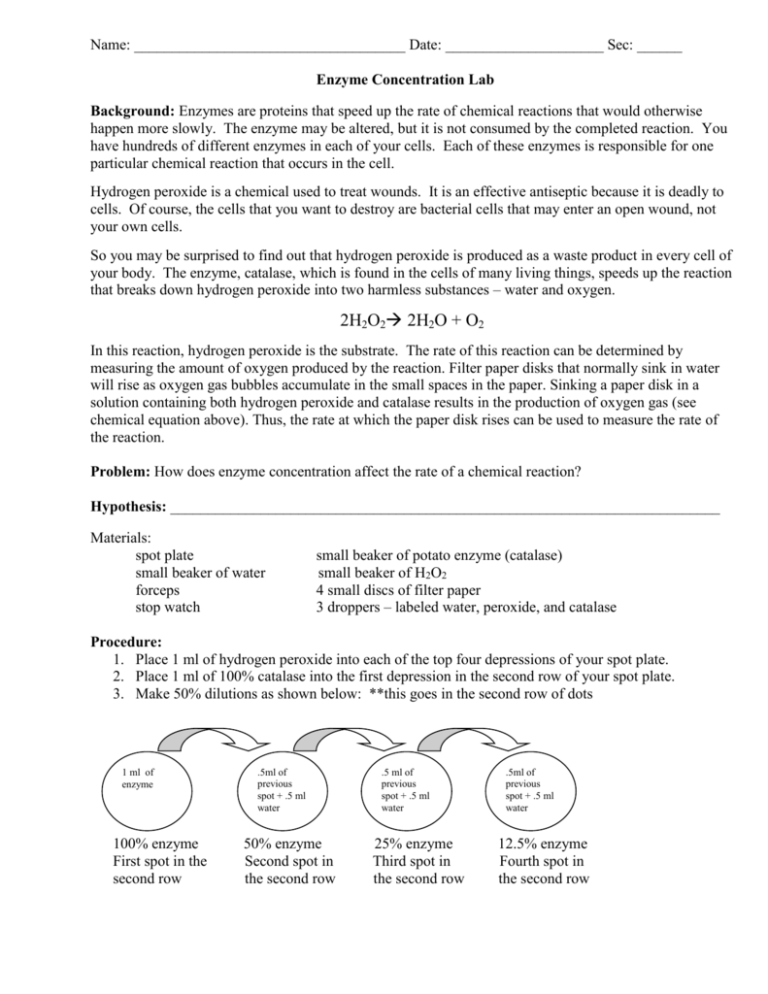
Name: ____________________________________ Date: _____________________ Sec: ______ Enzyme Concentration Lab Background: Enzymes are proteins that speed up the rate of chemical reactions that would otherwise happen more slowly. The enzyme may be altered, but it is not consumed by the completed reaction. You have hundreds of different enzymes in each of your cells. Each of these enzymes is responsible for one particular chemical reaction that occurs in the cell. Hydrogen peroxide is a chemical used to treat wounds. It is an effective antiseptic because it is deadly to cells. Of course, the cells that you want to destroy are bacterial cells that may enter an open wound, not your own cells. So you may be surprised to find out that hydrogen peroxide is produced as a waste product in every cell of your body. The enzyme, catalase, which is found in the cells of many living things, speeds up the reaction that breaks down hydrogen peroxide into two harmless substances – water and oxygen. 2H2O2 2H2O + O2 In this reaction, hydrogen peroxide is the substrate. The rate of this reaction can be determined by measuring the amount of oxygen produced by the reaction. Filter paper disks that normally sink in water will rise as oxygen gas bubbles accumulate in the small spaces in the paper. Sinking a paper disk in a solution containing both hydrogen peroxide and catalase results in the production of oxygen gas (see chemical equation above). Thus, the rate at which the paper disk rises can be used to measure the rate of the reaction. Problem: How does enzyme concentration affect the rate of a chemical reaction? Hypothesis: _________________________________________________________________________ Materials: spot plate small beaker of water forceps stop watch small beaker of potato enzyme (catalase) small beaker of H2O2 4 small discs of filter paper 3 droppers – labeled water, peroxide, and catalase Procedure: 1. Place 1 ml of hydrogen peroxide into each of the top four depressions of your spot plate. 2. Place 1 ml of 100% catalase into the first depression in the second row of your spot plate. 3. Make 50% dilutions as shown below: **this goes in the second row of dots 1 ml of enzyme 100% enzyme First spot in the second row .5ml of previous spot + .5 ml water 50% enzyme Second spot in the second row .5 ml of previous spot + .5 ml water 25% enzyme Third spot in the second row .5ml of previous spot + .5 ml water 12.5% enzyme Fourth spot in the second row <<<<READ THE FOLLOWING BEFORE PROCEEDING>>>> 4. Place a paper disc into each of the enzyme % depressions. 5. Use the forceps to pick up the filter paper discs in the 100% enzyme. Hold the forceps as close to the edge of the disc as possible. 6. Drop the disc into the BOTTOM of the hydrogen peroxide depression directly above it. 7. Begin timing IMMEDIATELY (as soon as the disc touches the hydrogen peroxide. 8. Stop timing when the disc rises back to the surface. 9. Enter your data in the table. 10. REPEAT steps 5-9 for each of the depressions. The enzyme soaked disc always goes into the hydrogen peroxide depression DIRECTLY above. 11. After completing the all of these steps – add 1 ml of hydrogen peroxide into an empty depression. 12. Soak a filter paper disc in water and drop it into the hydrogen peroxide depression. Time how long it takes the filter paper disc to sink and rise…if the time is longer than 3 minute (180 seconds)…STOP timing and enter the 180 seconds into the table. This is 0% enzyme. 13. Wash your spot plate. Dry it. Return it to the original location. TABLE % Catalase Enzyme Discs/min (60/sec for disc to rise) These are the top four depressions with hydrogen peroxide in them 100% 50% 25% 12.5% 0% These are your different % enzyme depressions. Analysis The independent variable that you had control over was _________________________ so it goes on the ____ axis. The dependent variable that you were measuring was ____________________________ so it goes on the _____ axis. 1. Now create a graph that shows the relationship between enzyme concentration and the rate of the reaction. 2. Does the data support your hypothesis? Why or why not?


