Progeny Genotypeb
advertisement
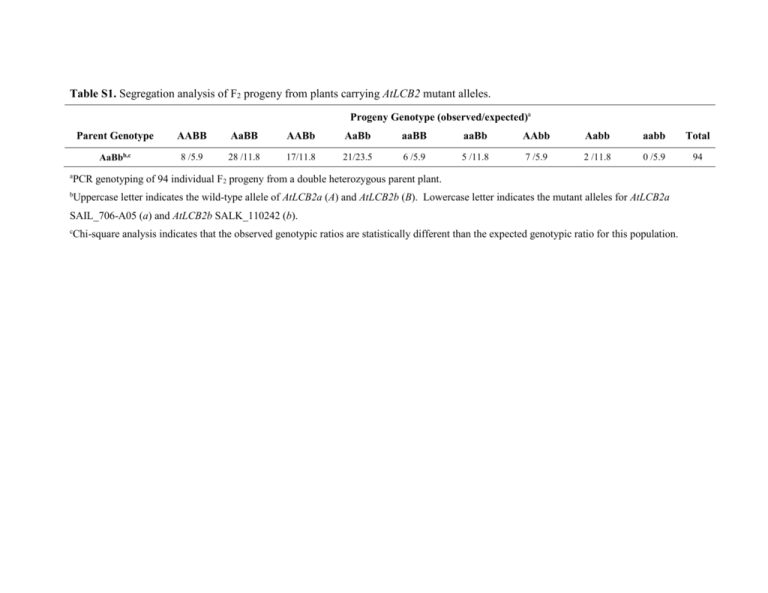
Table S1. Segregation analysis of F2 progeny from plants carrying AtLCB2 mutant alleles. Progeny Genotype (observed/expected)a a Parent Genotype AABB AaBB AABb AaBb aaBB aaBb AAbb Aabb aabb Total AaBbb,c 8 /5.9 28 /11.8 17/11.8 21/23.5 6 /5.9 5 /11.8 7 /5.9 2 /11.8 0 /5.9 94 PCR genotyping of 94 individual F2 progeny from a double heterozygous parent plant. b Uppercase letter indicates the wild-type allele of AtLCB2a (A) and AtLCB2b (B). Lowercase letter indicates the mutant alleles for AtLCB2a SAIL_706-A05 (a) and AtLCB2b SALK_110242 (b). c Chi-square analysis indicates that the observed genotypic ratios are statistically different than the expected genotypic ratio for this population. Table S2. Segregation analysis of progeny from reciprocal crosses of plants carrying mutant AtLCB2 alleles. a AaBb AaBB AABb Total aaBb - Femalec,d 102/118 133/118 N/Ae 235 aaBb – Maled,f 0/259 518/259 N/A 518 Aabb - Femalec,d 106/120 N/A 134/120 240 Aabb – Maled,f 0 /263 N/A 525/263 525 Uppercase letter indicates the wild-type allele of AtLCB2a (A) and AtLCB2b (B). Lowercase letter indicates the mutant alleles for AtLCB2a SAIL_706-A05 (a) and AtLCB2b SALK_110242 (b). b Genotypes were determined by the presence of selectable markers for the mutant alleles c Flowers from plants with the indicated genotypes were emasculated and pollinated with pollen from a wild-type plant. d Chi-square analysis indicates that the observed genotypic ratios are statistically different than the expected genotypic ratio for this population. e N/A, the designated genotype is not obtainable from the given parent plant. f Plants with indicated genotypes were used to pollinate emasculated flowers from wild-type plants.

