accuracy of tachyarrhythmia diagnosis on surface electrocardiograms
advertisement
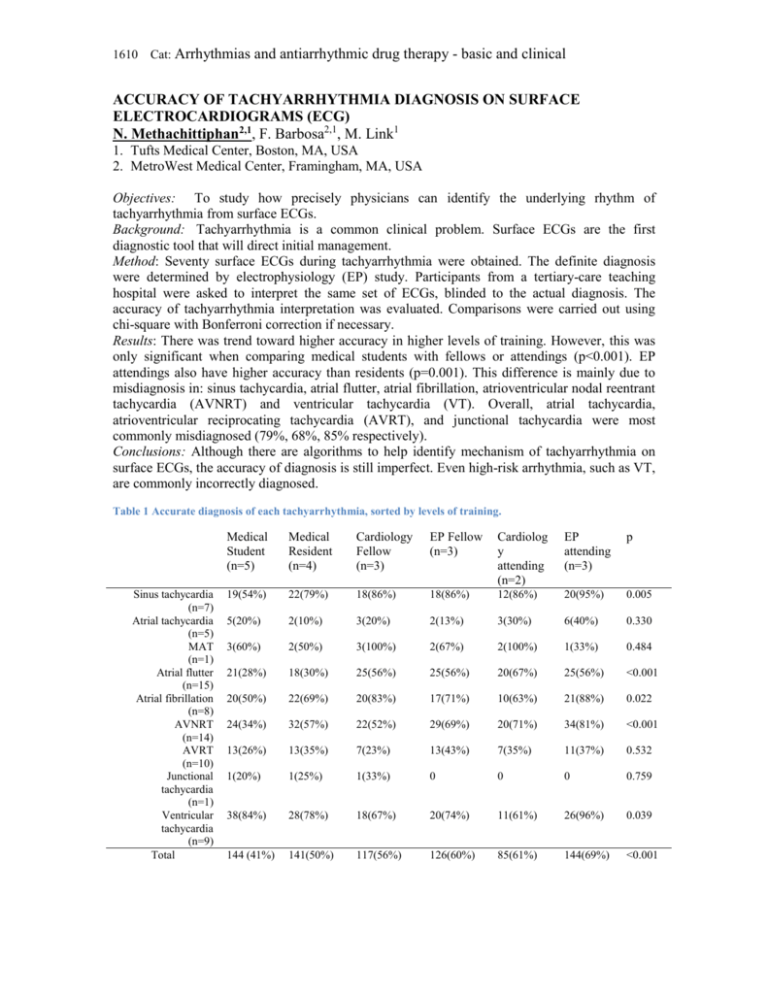
1610 Cat: Arrhythmias and antiarrhythmic drug therapy - basic and clinical ACCURACY OF TACHYARRHYTHMIA DIAGNOSIS ON SURFACE ELECTROCARDIOGRAMS (ECG) N. Methachittiphan2,1, F. Barbosa2,1, M. Link1 1. Tufts Medical Center, Boston, MA, USA 2. MetroWest Medical Center, Framingham, MA, USA Objectives: To study how precisely physicians can identify the underlying rhythm of tachyarrhythmia from surface ECGs. Background: Tachyarrhythmia is a common clinical problem. Surface ECGs are the first diagnostic tool that will direct initial management. Method: Seventy surface ECGs during tachyarrhythmia were obtained. The definite diagnosis were determined by electrophysiology (EP) study. Participants from a tertiary-care teaching hospital were asked to interpret the same set of ECGs, blinded to the actual diagnosis. The accuracy of tachyarrhythmia interpretation was evaluated. Comparisons were carried out using chi-square with Bonferroni correction if necessary. Results: There was trend toward higher accuracy in higher levels of training. However, this was only significant when comparing medical students with fellows or attendings (p<0.001). EP attendings also have higher accuracy than residents (p=0.001). This difference is mainly due to misdiagnosis in: sinus tachycardia, atrial flutter, atrial fibrillation, atrioventricular nodal reentrant tachycardia (AVNRT) and ventricular tachycardia (VT). Overall, atrial tachycardia, atrioventricular reciprocating tachycardia (AVRT), and junctional tachycardia were most commonly misdiagnosed (79%, 68%, 85% respectively). Conclusions: Although there are algorithms to help identify mechanism of tachyarrhythmia on surface ECGs, the accuracy of diagnosis is still imperfect. Even high-risk arrhythmia, such as VT, are commonly incorrectly diagnosed. Table 1 Accurate diagnosis of each tachyarrhythmia, sorted by levels of training. Sinus tachycardia (n=7) Atrial tachycardia (n=5) MAT (n=1) Atrial flutter (n=15) Atrial fibrillation (n=8) AVNRT (n=14) AVRT (n=10) Junctional tachycardia (n=1) Ventricular tachycardia (n=9) Total Medical Student (n=5) Medical Resident (n=4) Cardiology Fellow (n=3) EP Fellow (n=3) Cardiolog y attending (n=2) EP attending (n=3) p 19(54%) 22(79%) 18(86%) 18(86%) 12(86%) 20(95%) 0.005 5(20%) 2(10%) 3(20%) 2(13%) 3(30%) 6(40%) 0.330 3(60%) 2(50%) 3(100%) 2(67%) 2(100%) 1(33%) 0.484 21(28%) 18(30%) 25(56%) 25(56%) 20(67%) 25(56%) <0.001 20(50%) 22(69%) 20(83%) 17(71%) 10(63%) 21(88%) 0.022 24(34%) 32(57%) 22(52%) 29(69%) 20(71%) 34(81%) <0.001 13(26%) 13(35%) 7(23%) 13(43%) 7(35%) 11(37%) 0.532 1(20%) 1(25%) 1(33%) 0 0 0 0.759 38(84%) 28(78%) 18(67%) 20(74%) 11(61%) 26(96%) 0.039 144 (41%) 141(50%) 117(56%) 126(60%) 85(61%) 144(69%) <0.001

