Review #1 - TeacherWeb
advertisement
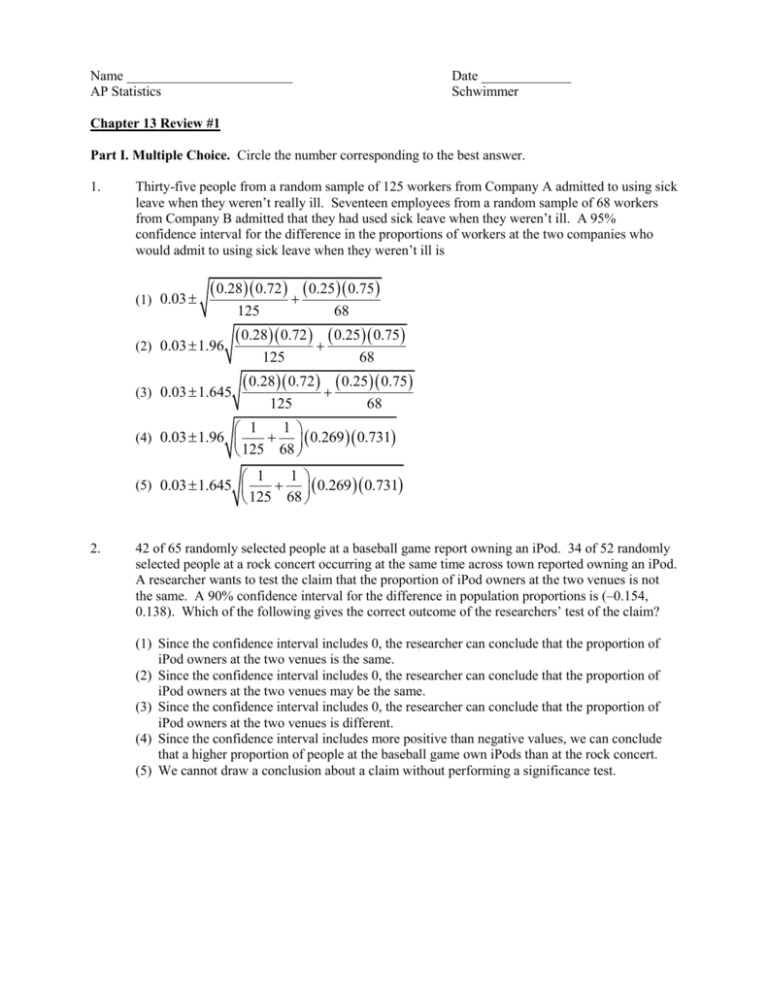
Name ________________________ AP Statistics Date _____________ Schwimmer Chapter 13 Review #1 Part I. Multiple Choice. Circle the number corresponding to the best answer. 1. Thirty-five people from a random sample of 125 workers from Company A admitted to using sick leave when they weren’t really ill. Seventeen employees from a random sample of 68 workers from Company B admitted that they had used sick leave when they weren’t ill. A 95% confidence interval for the difference in the proportions of workers at the two companies who would admit to using sick leave when they weren’t ill is (1) 0.03 0.28 0.72 0.25 0.75 (2) 0.03 1.96 125 68 0.28 0.72 0.25 0.75 125 68 0.28 0.72 0.25 0.75 (3) 0.03 1.645 125 68 1 1 0.269 0.731 125 68 (4) 0.03 1.96 1 1 0.269 0.731 125 68 (5) 0.03 1.645 2. 42 of 65 randomly selected people at a baseball game report owning an iPod. 34 of 52 randomly selected people at a rock concert occurring at the same time across town reported owning an iPod. A researcher wants to test the claim that the proportion of iPod owners at the two venues is not the same. A 90% confidence interval for the difference in population proportions is (–0.154, 0.138). Which of the following gives the correct outcome of the researchers’ test of the claim? (1) Since the confidence interval includes 0, the researcher can conclude that the proportion of iPod owners at the two venues is the same. (2) Since the confidence interval includes 0, the researcher can conclude that the proportion of iPod owners at the two venues may be the same. (3) Since the confidence interval includes 0, the researcher can conclude that the proportion of iPod owners at the two venues is different. (4) Since the confidence interval includes more positive than negative values, we can conclude that a higher proportion of people at the baseball game own iPods than at the rock concert. (5) We cannot draw a conclusion about a claim without performing a significance test. The next three questions refer to the following scenario: Sixty-eight people from a random sample of 128 residents of Uppsala, Sweden, had blue eyes. 45 people from a random sample of 110 people from Preston, England, had blue eyes. Let p1 represent the proportion of people in Uppsala with blue eyes, and let p 2 represent the proportion of people in Preston with blue eyes. 3. If researchers suspected that the distribution of eye color is different in these two countries before collecting the data, which of the following pairs of hypotheses would be appropriate to test? (1) H 0 : p1 0.53, p2 .41; H a : p1 0.53, p 2 .41 (2) H 0 : p1 p2 0.47; H a : p1 p 2 .47 (3) H 0 : p1 p 2 ; H a : p1 p2 (4) H 0 : p1 p 2 ; H a : p1 p2 (5) H 0 : p1 p 2 ; H a : p1 p2 4. Which of the following represents the correct conclusion for the significance test described in Question 3? (1) Reject H 0 at the 5% significance level since the P-value is 0.06. (2) Fail to reject H 0 at the 5% significance level since the P-value is 0.06. (3) Reject H 0 at the 5% significance level since the 95% confidence interval for p1 p2 is (–0.004, 0.248). (4) Reject H 0 at the 1% significance level. (5) Fail to reject H 0 at the 10% significance level. 5. Which of the conditions (1)-(3) is not necessary in order to perform the test in Question 3? (1) There must be at least 1280 people in Uppsala, Sweden and at least 1100 people in Preston, England. (2) np and n1 p must be large enough for Normal calculations to be reasonably accurate. (3) Two independent random samples must be taken. (4) None of the conditions in (1)-(3) are necessary. (5) All of the conditions in (1)-(3) are necessary. 6. The following are percents of fat found in 5 samples of each of two brands of ice cream: A B 5.7 6.3 4.5 5.7 6.2 5.9 6.3 6.4 7.3 5.1 Which of the following procedures is appropriate to test the hypothesis of equal average fat content in the two types of ice cream? (1) Paired t test with 5 df (2) Two-sample t test with 4 df (3) Paired t test with 4 df (4) Two-sample t test with 9 df (5) Two-proportion z test Part II. Free Response. Communicate your thinking clearly. Answer completely, but be concise. Show your work. 7. In the 2001 regular baseball season, the World Series Champion Arizona Diamondbacks played 81 games at home and 81 games away. They won 48 of their home games and 44 of the games played away. We can consider these games as samples from potentially large populations of games played at home and away. (a) Find the standard error needed to compute a confidence interval for the difference in the proportions of home games and away games that would be won by the Diamondbacks. (b) Construct and interpret a 90% confidence interval for the difference between the proportion of games that the Diamondbacks win at home and the proportion that they win when on the road. (c) Most people think that it is easier to win at home than away. Perform a significance test to determine whether this is true for the Arizona Diamondbacks. 8. Nitrites are often added to meat products as preservatives. In a study of the effect of these chemicals on bacteria, the rate of uptake of a radio-labeled amino acid was measured for a number of cultures of bacteria, some growing in a medium to which nitrites had been added. Here are the summary statistics from this study: Group Nitrite Control n 30 30 x 7880 8112 s 1115 1250 (a) Carry out a test of the research hypothesis that nitrites decrease amino acid uptake and report your results. (b) Construct and interpret a 95% confidence interval for the difference in population means.


