2 Lab 1.2 Outdoor Motion Lab
advertisement

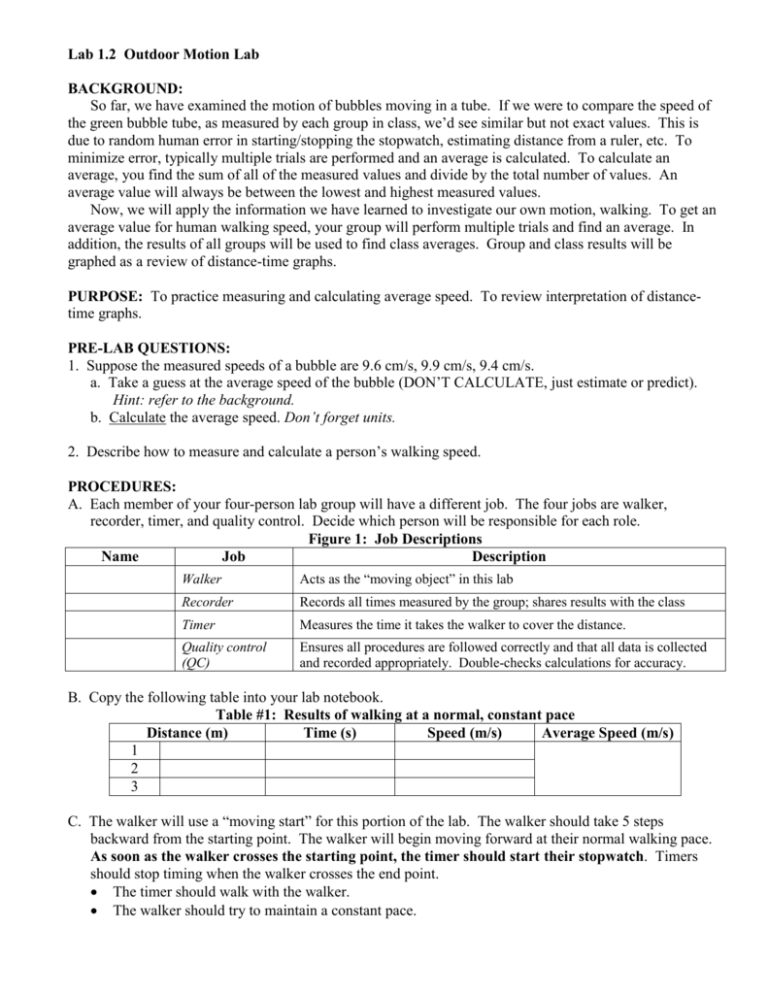
Lab 1.2 Outdoor Motion Lab BACKGROUND: So far, we have examined the motion of bubbles moving in a tube. If we were to compare the speed of the green bubble tube, as measured by each group in class, we’d see similar but not exact values. This is due to random human error in starting/stopping the stopwatch, estimating distance from a ruler, etc. To minimize error, typically multiple trials are performed and an average is calculated. To calculate an average, you find the sum of all of the measured values and divide by the total number of values. An average value will always be between the lowest and highest measured values. Now, we will apply the information we have learned to investigate our own motion, walking. To get an average value for human walking speed, your group will perform multiple trials and find an average. In addition, the results of all groups will be used to find class averages. Group and class results will be graphed as a review of distance-time graphs. PURPOSE: To practice measuring and calculating average speed. To review interpretation of distancetime graphs. PRE-LAB QUESTIONS: 1. Suppose the measured speeds of a bubble are 9.6 cm/s, 9.9 cm/s, 9.4 cm/s. a. Take a guess at the average speed of the bubble (DON’T CALCULATE, just estimate or predict). Hint: refer to the background. b. Calculate the average speed. Don’t forget units. 2. Describe how to measure and calculate a person’s walking speed. PROCEDURES: A. Each member of your four-person lab group will have a different job. The four jobs are walker, recorder, timer, and quality control. Decide which person will be responsible for each role. Figure 1: Job Descriptions Name Job Description Walker Acts as the “moving object” in this lab Recorder Records all times measured by the group; shares results with the class Timer Measures the time it takes the walker to cover the distance. Quality control (QC) Ensures all procedures are followed correctly and that all data is collected and recorded appropriately. Double-checks calculations for accuracy. B. Copy the following table into your lab notebook. Table #1: Results of walking at a normal, constant pace Distance (m) Time (s) Speed (m/s) Average Speed (m/s) 1 2 3 C. The walker will use a “moving start” for this portion of the lab. The walker should take 5 steps backward from the starting point. The walker will begin moving forward at their normal walking pace. As soon as the walker crosses the starting point, the timer should start their stopwatch. Timers should stop timing when the walker crosses the end point. The timer should walk with the walker. The walker should try to maintain a constant pace. D. The timer should report to the recorder; the recorder should record the time for the 1st distance in the data table. E. Repeat procedures C-D for a second and third trip (distances 2 and 3). The walker should try to maintain the same pace as before. F. Upon returning to the classroom, all members of the group should copy the data from the recorder. G. Work together to calculate the speed of the walker for each trip. Record your answers in the data table. H. Calculate the average walking speed for the walker. Record your answer in the data table. I. Share your group’s distance and time data with the class. Calculate the average time for the walkers for each distance. Draw a simple t-chart to record your answers. Distance Average Time (class data) J. Create a distance-time graph. Put distance (m) on the y-axis. Put time (s) on the x-axis. Plot the time and distance data for your group’s walker. Draw a line of best fit from the origin of the graph through the data points. Label the line “My Group’s Data”. Plot the average time and distance data for the class. Draw a line of best fit from the origin of the graph through the data points. Label the line “Class Average”. INTERPRETATIONS: 1. Looking at the graph, which was faster, the walker’s speed in your group or the class average? Explain your answer, describing the difference between the two lines on the graph. 2. If a person walked the class average speed, based on the graph, how much time would it take the person to walk 5 meters? 3. If a person walked the class average speed, based on the graph, how far would the person walk if they walked for 12 seconds? 4. If a person sprinted the distance instead of walking, how would their line look on the graph?


