Notes
advertisement
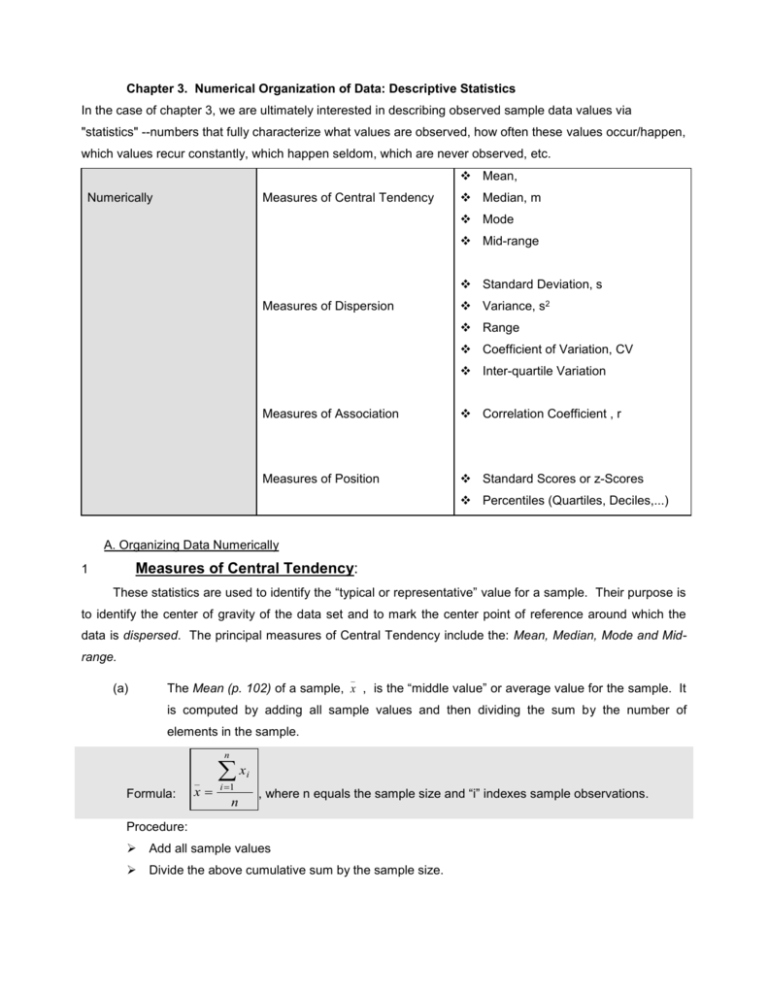
Chapter 3. Numerical Organization of Data: Descriptive Statistics In the case of chapter 3, we are ultimately interested in describing observed sample data values via "statistics" --numbers that fully characterize what values are observed, how often these values occur/happen, which values recur constantly, which happen seldom, which are never observed, etc. Mean, Numerically Measures of Central Tendency Median, m Mode Mid-range Standard Deviation, s Measures of Dispersion Variance, s2 Range Coefficient of Variation, CV Inter-quartile Variation Measures of Association Correlation Coefficient , r Measures of Position Standard Scores or z-Scores Percentiles (Quartiles, Deciles,...) A. Organizing Data Numerically Measures of Central Tendency: 1 These statistics are used to identify the “typical or representative” value for a sample. Their purpose is to identify the center of gravity of the data set and to mark the center point of reference around which the data is dispersed. The principal measures of Central Tendency include the: Mean, Median, Mode and Midrange. _ (a) The Mean (p. 102) of a sample, x , is the “middle value” or average value for the sample. It is computed by adding all sample values and then dividing the sum by the number of elements in the sample. n _ Formula: x x i 1 n i , where n equals the sample size and “i” indexes sample observations. Procedure: Add all sample values Divide the above cumulative sum by the sample size. (b) The Median (p. 104) of a sample, xm, is the “middle observation” of a sample. To identify the median of a sample one must first sort the sample in ascending or descending order. Then one simply identifies the observation in the middle: When the sample size, n, is an odd number the median is the [(n+1)/2 ]th observation. When the sample size, n, is an even number the median is the average of the two (2) middle observations: n/2 and (n+2)/2. Formula: x nsorted , n is odd 1 2 x m x sorted x sorted n n2 2 1 , n is even 2 Procedure: Sort the numbers that make up the sample Identify the middle value (c) The Mode (p.105) of a sample is the most frequently repeated number in the sample. (d) The Mid-Range is the value between the smallest and the largest observed values. (e) The Geometric Mean (p.107) is a measure of central tendency by value when data is cumulatively building (or eroding) over a factor, such as time. It is a multiplicative form of averaging. We will look at a sample problem in class (LP 3.18 on p. 120). 2 Frequency-based uses of Central Tendency Measures (p.116) When mean = median, the shape of the frequency distribution of a data set is said to be SYMMETRIC. When mean > median, the shape of the frequency distribution of a data set is said to be SKEWED RIGHT. When mean < median, the shape of the frequency distribution of a data set is said to be SKEWED LEFT. Measures of Dispersion: 3 These measures quantify the dispersion or variability of the sample around the reference point for the sample –i.e., the applicable measure of central tendency in use. The principal measures of Dispersion include the: Variance, Standard Deviation, and Range. (a) The Variance (P.110) is the sum of all squared deviations from the mean found in the sample of interest, divided by the adjusted sample size (degrees of freedom). x x_ i i 1 2 s n 1 n Formula: 2 Procedure to calculate variance: Calculate the mean of the sample _ xi x Identify the deviation from the mean of each observation in the sample: Square each deviation Add all the squared deviations together Divide the cumulative sum of squared deviations by the remaining “degrees of freedom”: n-1 (b) The Standard Deviation (P.110) is the square root of the Variance. Standard refers to the fact that the statistic is a measure of the average dispersion around the mean. Another reason to use the Std. Deviation as opposed to the Variance is that the former is expressed in the same units of measurement as the data itself and thus lends itself to easier interpretation. x n Formula: s i 1 x n 1 _ 2 i Procedure: 5 steps as above. Calculate the square root of the number yielded by above steps. (c) The Range is the difference between the largest and smallest numerical values in the sample. (d) The Coefficient of Variation (p. 114) is a unit-less, relative measure of dispersion. It is calculated by dividing the standard deviation by the mean of a dataset, and is generally expressed in % form. It measures dispersion relative to the mean. (e) The Inter-quartile Variation (p. 109) is a descriptive statistic that measures dispersion by position. The value of the first quartile (25th percentile) of a ranked dataset is subtracted from the value of the third quartile (75th percentile) of the same dataset. (f) The Range (p.109) simply measures the difference between the largest and smallest data values. 4 Measures of Association These statistics measure relations BETWEEN two or more variables. The two most common statistics in this category are the covariance and the correlation coefficient, r (p. 130). The appeal of the correlation coefficient is that r measures association as a ratio of dispersions in each dataset separately versus jointly. We will use the REFRIGERATOR dataset in class to practice how to compute r. 5 Measures of Position These statistics inform us on the relative “position” or place or ranking of individual observations in a sample. Thus they are useful in activities such as grading or evaluating the performance of individual observations in a sample (Course Grading, Customer Satisfaction, Employee Performance Evaluations, etc.). The most common position measures are: Percentiles and Standard Scores (a.k.a., z-Scores) (a) z-Scores are ratio statistics calculated for each sample observation. The numerator consists of the observations deviation from the mean for the whole sample and the denominator for the statistic is the Standard Deviation. _ Formula: x x zi i , for each and every sample observation i. s Procedure: Obtain the mean and standard deviation for the sample of interest. Calculate the individual observation’s deviation from the mean. Divide the individual deviation by the standard deviation. (b) Percentiles rank observations on a % scale with respect to the range of scores included in the sample. The smallest value in a sample is the 0-th percentile and the highest score is the 100-th percentile. All other scores fall somewhere in between.


