Descriptive Statistics: Central Tendency & Dispersion
advertisement
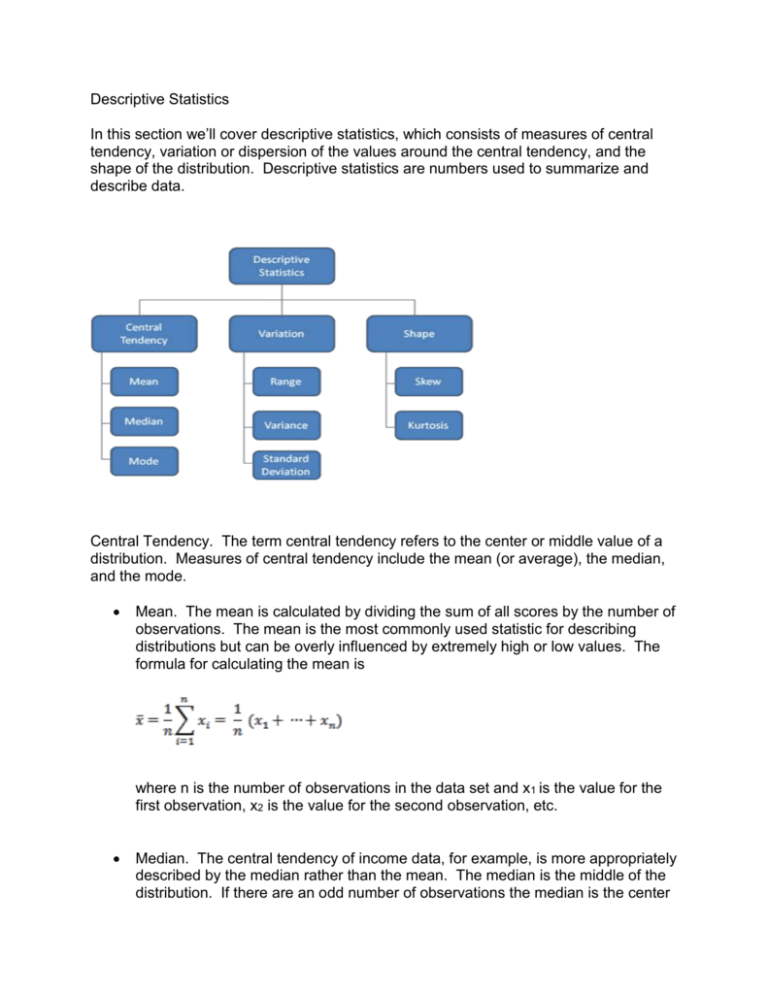
Descriptive Statistics In this section we’ll cover descriptive statistics, which consists of measures of central tendency, variation or dispersion of the values around the central tendency, and the shape of the distribution. Descriptive statistics are numbers used to summarize and describe data. Central Tendency. The term central tendency refers to the center or middle value of a distribution. Measures of central tendency include the mean (or average), the median, and the mode. Mean. The mean is calculated by dividing the sum of all scores by the number of observations. The mean is the most commonly used statistic for describing distributions but can be overly influenced by extremely high or low values. The formula for calculating the mean is where n is the number of observations in the data set and x1 is the value for the first observation, x2 is the value for the second observation, etc. Median. The central tendency of income data, for example, is more appropriately described by the median rather than the mean. The median is the middle of the distribution. If there are an odd number of observations the median is the center value in which exactly half of the observations are lower and exactly half of the observations are higher. If there is an even number of observations, the median is the average of the two middle values. State income data is frequently reported, as in the following table, in terms of median values. State Maryland New Jersey Connecticut Alaska Hawaii Massachusetts New Hampshire Virginia California Washington Delaware District of Columbia Minnesota Colorado Utah Nevada Illinois New York Rhode Island Wyoming Vermont Wisconsin Arizona Georgia Pennsylvania Kansas Oregon Texas Nebraska Iowa 2008 Median Income $70,545 $70,378 $68,595 $68,460 $67,214 $65,401 $63,731 $61,233 $61,021 $58,078 $57,989 $57,936 $57,288 $56,993 $56,633 $56,361 $56,235 $56,033 $55,701 $53,207 $52,104 $52,094 $50,958 $50,861 $50,713 $50,177 $50,169 $50,043 $49,693 $48,980 In the following list of the 25 richest Americans in 2009, as reported in Forbes Magazine September 30, 2009, the median value would be $14,500 million, the net worth of Michael Dell, the founder of Dell Computers. Name William Gates III Warren Buffett Lawrence Ellison Christy Walton & family Jim C. Walton Alice Walton S. Robson Walton Michael Bloomberg Charles Koch David Koch Sergey Brin Larry Page Michael Dell Steven Ballmer George Soros Donald Bren Paul Allen Abigail Johnson Forrest Edward Mars John Mars Jacqueline Mars Carl Icahn Ronald Perelman George B. Kaiser Philip Knight Net Worth ($mil) 50,000 Source Microsoft 40,000 Berkshire Hathaway 27,000 Oracle 21,500 Wal-Mart 19,600 Wal-Mart 19,300 Wal-Mart 19,000 Wal-Mart 17,500 Bloomberg 16,000 manufacturing, energy 16,000 manufacturing, energy 15,300 Google 15,300 Google 14,500 Dell 13,300 Microsoft 13,000 hedge funds 12,000 real estate 11,500 Microsoft, investments 11,500 Fidelity 11,000 candy, pet food 11,000 candy, pet food 11,000 candy, pet food 10,500 leveraged buyouts 10,000 leveraged buyouts 9,500 oil & gas, banking 9,500 Nike Mode. The mode is the value that occurs most frequently in a list of numbers. For example, in the top forty home run hitters in baseball in the American League for the 2009 season as listed below, the mode is 25. Please note that it is possible for there to be more than one mode (bi-modal, tri-modal,etc. distributions). American League Player Carlos Pena Mark Teixeira Jason Bay 2009 Home Runs 39 39 36 Aaron Hill Adam Lind Miguel Cabrera Kendry Morales Nelson Cruz Evan Longoria Michael Cuddyer Russell Branyan Ian Kinsler Alex Rodriguez Justin Morneau Curtis Granderson Nick Swisher Paul Konerko David Ortiz Hideki Matsui Joe Mauer Jason Kubel Jermaine Dye Brandon Inge Kevin Youkilis Ben Zobrist Jack Cust Juan Rivera Hank Blalock Jose Lopez Robinson Cano Luke Scott Johnny Damon J.D. Drew Jim Thome Victor Martinez Miguel Olivo Jorge Posada Torii Hunter Michael Young Carlos Quentin 36 35 34 34 33 33 32 31 31 30 30 30 29 28 28 28 28 28 27 27 27 27 25 25 25 25 25 25 24 24 23 23 23 22 22 22 21 Please look at the DescriptiveStatisticsCentralTendency video clip to learn how to calculate these measures of central tendency using Excel. Dispersion. Dispersion refers to the variation or spread of the values around the central tendency in a distribution. The measures of dispersion that are most commonly cited are the range, variation, and standard deviation. Range. The range is simply the difference between the highest and lowest value in a distribution. For example in our home run data above, the highest number of home runs is 39 and the lowest number of home runs is 21, so the range would be 39 – 21 = 18. Variance. The variance of a sample indicates how the observations are spread around the mean. Variance is calculated with the following formula where is the value of the variable for a particular observation, x is the mean of the distribution, and n is the number of observations in the sample. The variance, while used in a number of calculations statistics that we’ll go over later in this course, in and of itself doesn’t really provide anything particularly useful for us in terms of describing our distribution. A more useful statistic related to the dispersion around the mean is a simple extension of the variance, the standard deviation. Standard Deviation. The standard deviation s is the square root of the variance s2. The formula for the standard deviation is: The standard deviation is particularly useful. As depicted below, in a normal distribution approximately 68 % of the observations would fall within one standard deviation from the mean. That is, approximately 68% of the observations would fall between one standard deviation below the mean and one standard deviation above the mean. Approximately 95% of observations lie between ± 2 standard deviations from the mean and almost 100% of observations lie between ± 3 standard deviations from the mean. Please look at the StandardDeviation video clip to learn how to calculate the variance and standard deviation using Excel. Shape. The shape of a curve (distribution of scores) may be symmetrical or asymmetrical. If symmetrical the two halves of the curve will almost be mirror images of each other. Normal curve. A symmetrical distribution is also referred to as the normal curve and is presented below. Skewed. If the numbers tend to cluster at the lower end of the scale and are fewer at the higher end of the scale the distribution is referred to as right skewed. On the other hand, if the numbers tend to cluster at the higher end and are fewer at the lower end the distribution is referred to as left skewed. Skewed distributions are graphed below. Kurtosis. A final property of shapes is how peaked or flat a distribution is. This property is known as kurtosis and is graphed below.

