How do wind meters work?
advertisement
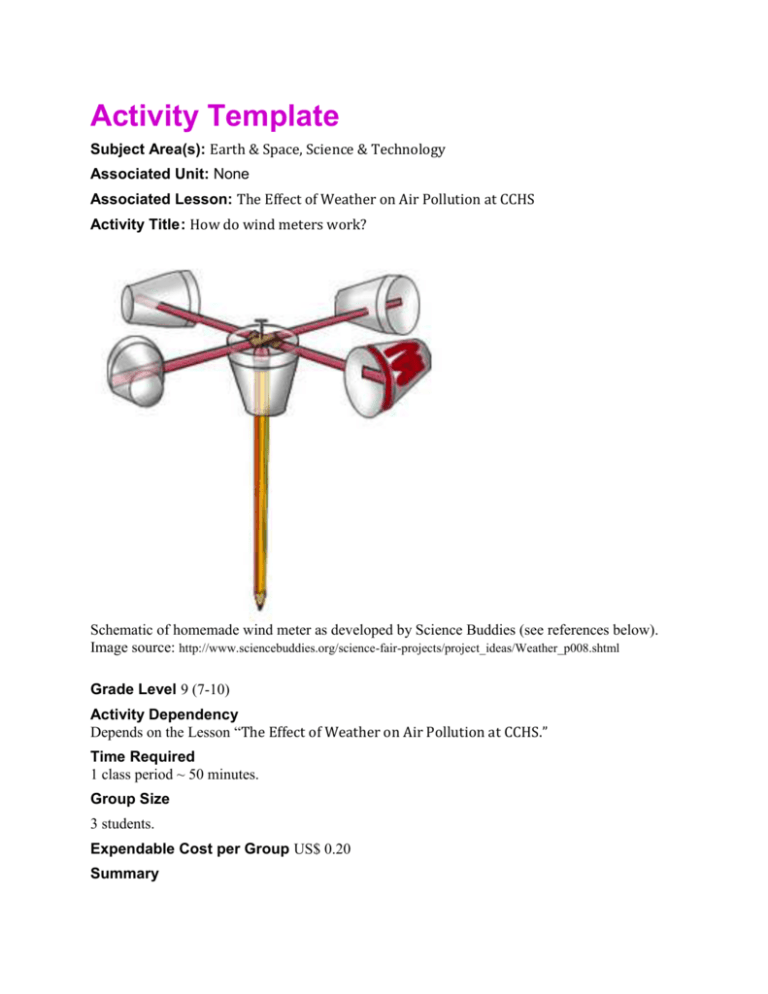
Activity Template Subject Area(s): Earth & Space, Science & Technology Associated Unit: None Associated Lesson: The Effect of Weather on Air Pollution at CCHS Activity Title : How do wind meters work? Schematic of homemade wind meter as developed by Science Buddies (see references below). Image source: http://www.sciencebuddies.org/science-fair-projects/project_ideas/Weather_p008.shtml Grade Level 9 (7-10) Activity Dependency Depends on the Lesson “The Effect of Weather on Air Pollution at CCHS.” Time Required 1 class period ~ 50 minutes. Group Size 3 students. Expendable Cost per Group US$ 0.20 Summary In this experiment, students will make their own wind meter, or anemometer. An anemometer is useful because it rotates with the wind. To calculate the velocity at which the anemometer spins, students will determine the number of revolutions per minute (RPM). To test each anemometer, students will compare their RPMs to the more accurate wireless anemometer we have in the classroom. Engineering Connection The students are encouraged to explore many different designs and even iterate the design process. Furthermore, the students then compare their self-constructed wind meters to the hightech wind meter in the classroom. Engineering Category (3) This activity provides engineering analysis or partial design. Level of Inquiry Guided inquiry Keywords: experimentation, measurement, wind, weather. Educational Standards 1) CA State Standards addressed: IE 1. Scientific progress is made by asking meaningful questions and conducting careful investigations. As a basis for understanding this concept and addressing the content in the other three reporting clusters, students should develop their own questions and perform investigations. IE 1A - Select and use appropriate tools and technology (such as computer-linked probes, spreadsheets, and graphing calculators) to perform tests, collect data, analyze relationships, and display data. IE 1B - Identify and communicate sources of unavoidable experimental error. IE 1C - Identify possible reasons for inconsistent results, such as sources of error or uncontrolled conditions. IE 1D - Formulate explanations by using logic and evidence. IE 1G - Recognize the usefulness and limitations of models and theories as scientific representations of reality. IE 1J - Recognize the issues of statistical variability and the need for controlled tests. IE 1K - Recognize the cumulative nature of scientific evidence. ES 4C - Students know the different atmospheric gases that absorb the Earth’s thermal radiation and the mechanism and significance of the greenhouse effect. ES 6A - Students know weather (in the short run) and climate (in the long run) involve the transfer of energy into and out of the atmosphere. ES 8C - Students know the location of the ozone layer in the upper atmosphere, its role in absorbing ultraviolet radiation, and the way in which this layer varies both naturally and in response to human activities. 2) National Standards addressed: NS.9-12.2 Physical Science - Structure and properties of matter. Interactions of matter and energy. Science as Inquiry Standards (9-12): Abilities necessary to do inquiry Understanding about scientific inquiry Pre-Requisite Knowledge Students should know basic arithmetic and unit conversions. Learning Objectives After this activity, students should be able to: Explain how a wind meter works and collect wind speed data using their own. Materials List Each group needs: Two plastic straws (non-bendy straws) 5 paper cups. 1 pencil. 1 pushpin tack. 1 copy of student handout [see attachment]. To share with the entire class: Stapler. Tape. Rulers. Stop watch(es). Introduction / Motivation How can the speed of something as ethereal as wind be measured? Using only simple supplies such as straws and cups, what sort of apparatus could we make in order to determine the wind speed? Meteorologists and environmental scientists use wind meters all the time in their studies. Today we will make our own wind meters and compare them to the more accurate wireless wind meter. As always and in the spirit of the scientific method you may find it necessary to improve upon the simple design shown in the handout. This is always encouraged, and students who demonstrate a significant design improvement over the design in the handout will earn extra credit. Vocabulary / Definitions Word RPM Revolutions per minute Definition Anemometer A device used for measuring wind speed. Procedure See attached student handout. Background Before the Activity Stress that students who demonstrate a design improvement over the suggested design will earn significant extra credit for their hard work. With the Students 1. Brainstorm possible designs given the supplies at hand before giving the students the handout. 2. Demonstrate how a model wind meter (that the teacher has prepared beforehand) can be used to measure wind speed. Have student-volunteers assist in the demonstration. 3. Break students up into groups and distribute the handout. 4. Once students get a workable design completed, take them outside to collect some wind speed data. Once the students have collected the data they can compare to the more accurate wind meter. 5. Step 4 can be iterated for those students who decide they want to improve on the design. Attachments Student worksheet with procedure and data tables is attached (see below). Safety Issues No significant safety issues since the supplies (paper cups and straws) are mostly benign. Troubleshooting Tips Some wind meters may not rotate at all. Alert students to this possibility before hand and encourage them not to get discouraged. It may be beneficial to discuss with the class as a whole at the outset possible ways of alleviating this problem. Investigating Questions Not provided. Assessment Pre-Activity Assessment Title: How is wind measured? As a group in the brainstorming session, ask students how wind is measured? How do scientists go about measuring it? Can we do it right here in class with simple supplies? Activity Embedded Assessment Title: Does the wind meter work? Are the students getting reasonably accurate data from their wind meter? Post-Activity Assessment Title: Student Handout The completed student handout will serve as a useful post-activity assessment. Activity Extensions As a component of the “Weather and Air Pollution” lesson, the students will use data from the wind meter to draw conclusions about the connection between air pollution and weather. Activity Scaling For lower grades, ease them into the calculations by going over a few sample calculations. For upper grades, include a component using a fan to see if the wind meter’s efficacy varies with wind speed. Additional Multimedia Support References The instructions on how to build an anemometer are taken directly from Science Buddies Science Fair Project Ideas website steps 1-9: http://www.sciencebuddies.org/science-fairprojects/project_ideas/Weather_p008.shtml, and were developed by Sara Agee, Ph.D. Owner UCLA SEE-LA GK-12 Program, University of California, Los Angeles Contributors Ian Shoemaker, Denise Greenberg. This activity was field tested at Culver City Middle School in 9th grade Earth Science classes. Copyright Name _____________________________________________Date_______________________ Period ____________________________________________ Lab partners________________________________________ Group Name______________________________________ How do wind meters work? 1) Take four of the paper cups and use the hole punch to punch one hole in the side of each cup, about a half inch below the rim. 2) Take one of the four cups and push a soda straw through the hole. Fold the end of the straw and staple it to the side of the cup across from the hole. Repeat this procedure for another onehole cup and the second straw. 3) Take the fifth cup and punch four equally spaced holes in the side of the cup, about a quarter inch below the rim. Then punch a hole in the center of the bottom of the cup. 4) Slide one cup and straw assembly through two opposite holes in the cup with four holes. Push another one-hole cup onto the end of the straw just pushed through the four-hole cup. 5) Bend the straw and staple it to the one-hole cup, making certain that the cup faces the opposite direction from the first cup. Repeat this procedure using the other cup and straw assembly and the remaining one-hole cup. 6) Align the four cups so that their open ends face in the same direction either clockwise or counter-clockwise around the center cup. 7) Push the straight pin through the two straws where they intersect. 8) Push the eraser end of the pencil through the bottom hole in the center cup. Push the pin into the end of the pencil eraser as far as it will go. 9) Now your wind meter is ready for use! It should look like this: Note: The above instructions about how to build an anemometer are verbatim from Science Buddies Science Fair Project Ideas website steps 1-9: http://www.sciencebuddies.org/sciencefair-projects/project_ideas/Weather_p008.shtml Column 1 Column 2 Column 3 Revolutions/min Cup-to-cup distance (inches) 3 x (column 1) x (column 2)/1000 (mph) 1st Trial 2nd Trial 3rd Trial 4th Trial HOW TO FILL OUT THE TABLE 10) Count the number of times the colored cup goes around in one minute. Record this number in column 1. 11) Then measure the distance from one cup to the cup across from it. Record this number in column 2. 12) We want to find the wind speed in miles per hour. To do this use a calculator to find 3 x (column 1) x (column 2)/1000. Record this number in column 3. This is the wind speed in mph. COMPARE TO THE WIRELESS WINDMETER Column 1 Column 2 Your wind speed (mph) (column 3 from above) Wireless wind meter's speed (mph) Column 3 (Column 2) – (Column 1) Trial 1 Trial 2 Trial 3 Trial 4 Average QUESTIONS 1) Why do we repeat the procedure multiple times instead of just doing it once? 2) Why is there a difference between your wind speed and the speed that the wireless wind monitor finds?

