Graphing Atmospheric Layers Lab Worksheet
advertisement
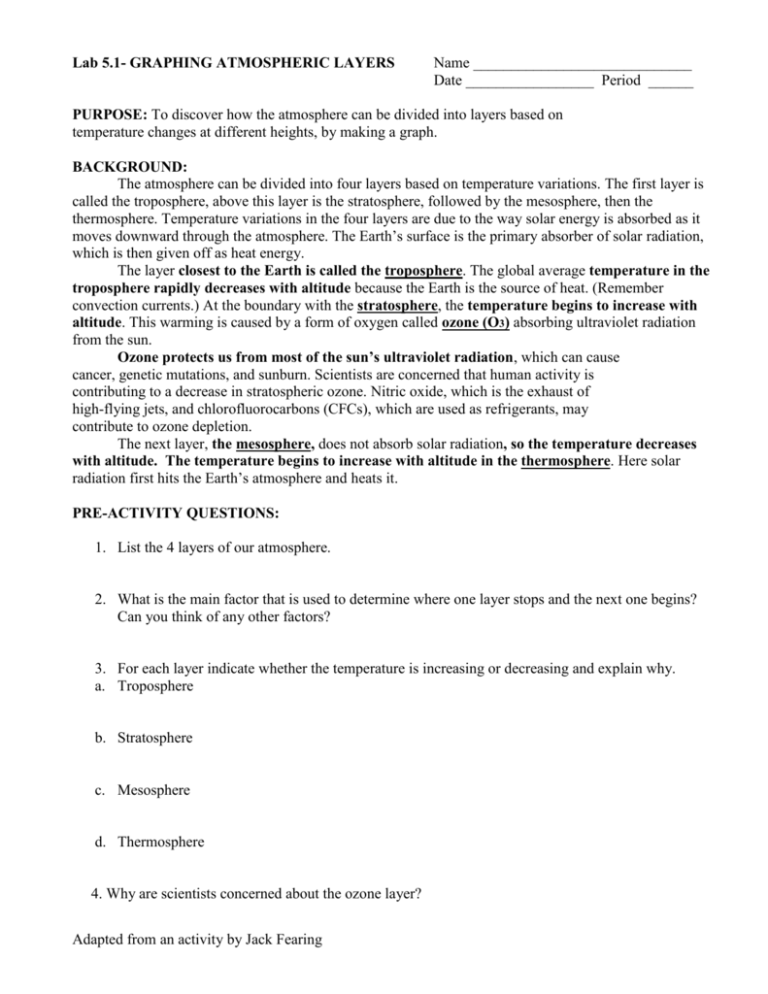
Lab 5.1- GRAPHING ATMOSPHERIC LAYERS Name _____________________________ Date _________________ Period ______ PURPOSE: To discover how the atmosphere can be divided into layers based on temperature changes at different heights, by making a graph. BACKGROUND: The atmosphere can be divided into four layers based on temperature variations. The first layer is called the troposphere, above this layer is the stratosphere, followed by the mesosphere, then the thermosphere. Temperature variations in the four layers are due to the way solar energy is absorbed as it moves downward through the atmosphere. The Earth’s surface is the primary absorber of solar radiation, which is then given off as heat energy. The layer closest to the Earth is called the troposphere. The global average temperature in the troposphere rapidly decreases with altitude because the Earth is the source of heat. (Remember convection currents.) At the boundary with the stratosphere, the temperature begins to increase with altitude. This warming is caused by a form of oxygen called ozone (O3) absorbing ultraviolet radiation from the sun. Ozone protects us from most of the sun’s ultraviolet radiation, which can cause cancer, genetic mutations, and sunburn. Scientists are concerned that human activity is contributing to a decrease in stratospheric ozone. Nitric oxide, which is the exhaust of high-flying jets, and chlorofluorocarbons (CFCs), which are used as refrigerants, may contribute to ozone depletion. The next layer, the mesosphere, does not absorb solar radiation, so the temperature decreases with altitude. The temperature begins to increase with altitude in the thermosphere. Here solar radiation first hits the Earth’s atmosphere and heats it. PRE-ACTIVITY QUESTIONS: 1. List the 4 layers of our atmosphere. 2. What is the main factor that is used to determine where one layer stops and the next one begins? Can you think of any other factors? 3. For each layer indicate whether the temperature is increasing or decreasing and explain why. a. Troposphere b. Stratosphere c. Mesosphere d. Thermosphere 4. Why are scientists concerned about the ozone layer? Adapted from an activity by Jack Fearing DIRECTIONS: 1. Table 1 contains the average temperature readings at various altitudes in the Earth’s atmosphere. Plot this data on the graph and connect adjacent points with a smooth curve. Be careful to plot the negative temperature numbers correctly. 2. Use information from the background to draw a line between each layer. (Hint: You should have 3 lines.) 3. On the left side of the Y axis (Altitude), write the name of each layer. 4. Below the appropriate line, write ozone layer. Adapted from an activity by Jack Fearing Name _____________________________Date _____________ Period ______ Adapted from an activity by Jack Fearing

![Earth's Atmosphere Earths Atmosphere [Autosaved]](http://s2.studylib.net/store/data/010123574_1-f1783c71f4d74c47566894d317b29466-300x300.png)
