TPJ_4710_sm_Lokerse-Suppl-Legends
advertisement
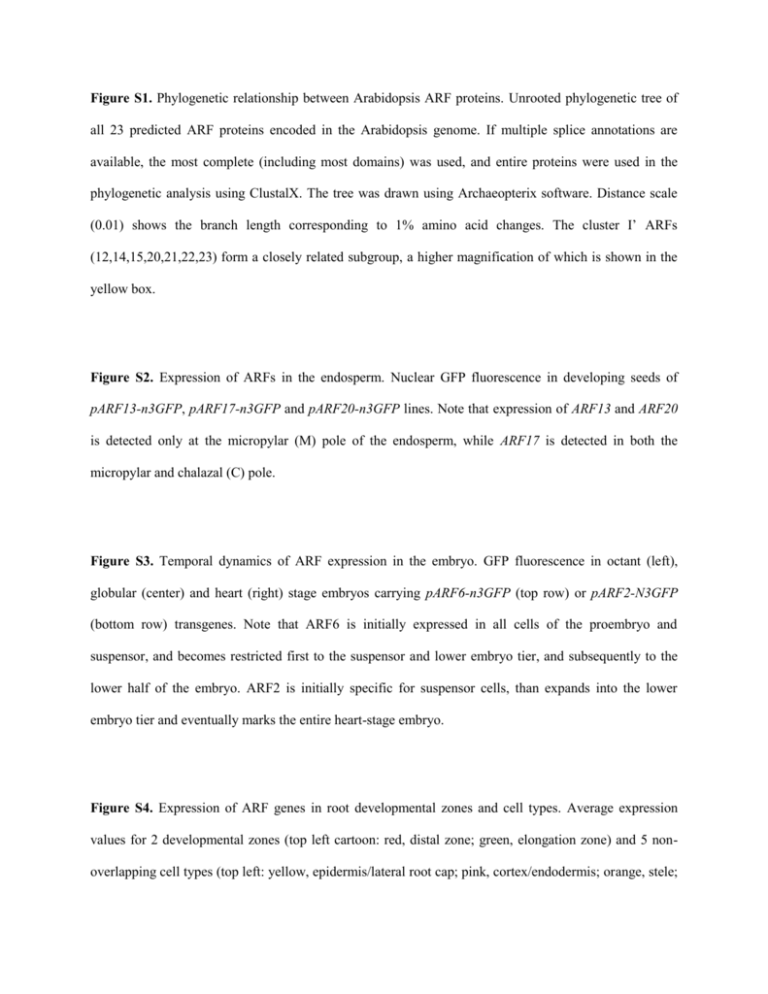
Figure S1. Phylogenetic relationship between Arabidopsis ARF proteins. Unrooted phylogenetic tree of all 23 predicted ARF proteins encoded in the Arabidopsis genome. If multiple splice annotations are available, the most complete (including most domains) was used, and entire proteins were used in the phylogenetic analysis using ClustalX. The tree was drawn using Archaeopterix software. Distance scale (0.01) shows the branch length corresponding to 1% amino acid changes. The cluster I’ ARFs (12,14,15,20,21,22,23) form a closely related subgroup, a higher magnification of which is shown in the yellow box. Figure S2. Expression of ARFs in the endosperm. Nuclear GFP fluorescence in developing seeds of pARF13-n3GFP, pARF17-n3GFP and pARF20-n3GFP lines. Note that expression of ARF13 and ARF20 is detected only at the micropylar (M) pole of the endosperm, while ARF17 is detected in both the micropylar and chalazal (C) pole. Figure S3. Temporal dynamics of ARF expression in the embryo. GFP fluorescence in octant (left), globular (center) and heart (right) stage embryos carrying pARF6-n3GFP (top row) or pARF2-N3GFP (bottom row) transgenes. Note that ARF6 is initially expressed in all cells of the proembryo and suspensor, and becomes restricted first to the suspensor and lower embryo tier, and subsequently to the lower half of the embryo. ARF2 is initially specific for suspensor cells, than expands into the lower embryo tier and eventually marks the entire heart-stage embryo. Figure S4. Expression of ARF genes in root developmental zones and cell types. Average expression values for 2 developmental zones (top left cartoon: red, distal zone; green, elongation zone) and 5 nonoverlapping cell types (top left: yellow, epidermis/lateral root cap; pink, cortex/endodermis; orange, stele; dark blue, quiescent center; light blue, columella root cap) after [Birnbaum et al., Science (2003) 302, 1956-1960]. Color legend (top right) shows colors corresponding to expression values. All ARFs for which uniquely matching probesets are available on the Affymetrix ATH1 array, and whose expression could be detected in pARF-n3GFP lines are depicted in two cartoons displaying expression in zones (left) or cell types (right). Figure S5. Floral phenotypes in arf multiple mutants. Inflorescences (upper panel) and dissected flowers (lower panel) of wild-type (WT), arf1-5 arf6-1, arf2-8 arf6-1, arf1-5 arf2-8 and arf1-5 arf2-8 arf6-1 mutant plants. All double and triple mutant plants suffer from decreased fertility. All combinations that include arf2-8 show a failure in opening of the flower. Note that the reduced stamen size in mutants carrying the arf2-8 allele is enhanced in the triple mutant flower. Also, petal size appears strongly reduced in the triple mutant. Figure S6. Effect of GR-bdl induction on ARF and Aux/IAA gene expression. Relative expression of ARF (blue) and Aux/IAA (yellow) genes in DEX/IAA-treated RPS5A-GR-bdl seedlings, compared to IAA-treated controls (set to 1). Microarray data were from (Schlereth et al., 2010). Note that while most Aux/IAA genes are strongly downregulated by DEX-treatment, most ARF genes are unaffected. Table S1. Oligonucleotides used in this study.
