A rain-rate map for the UK
advertisement
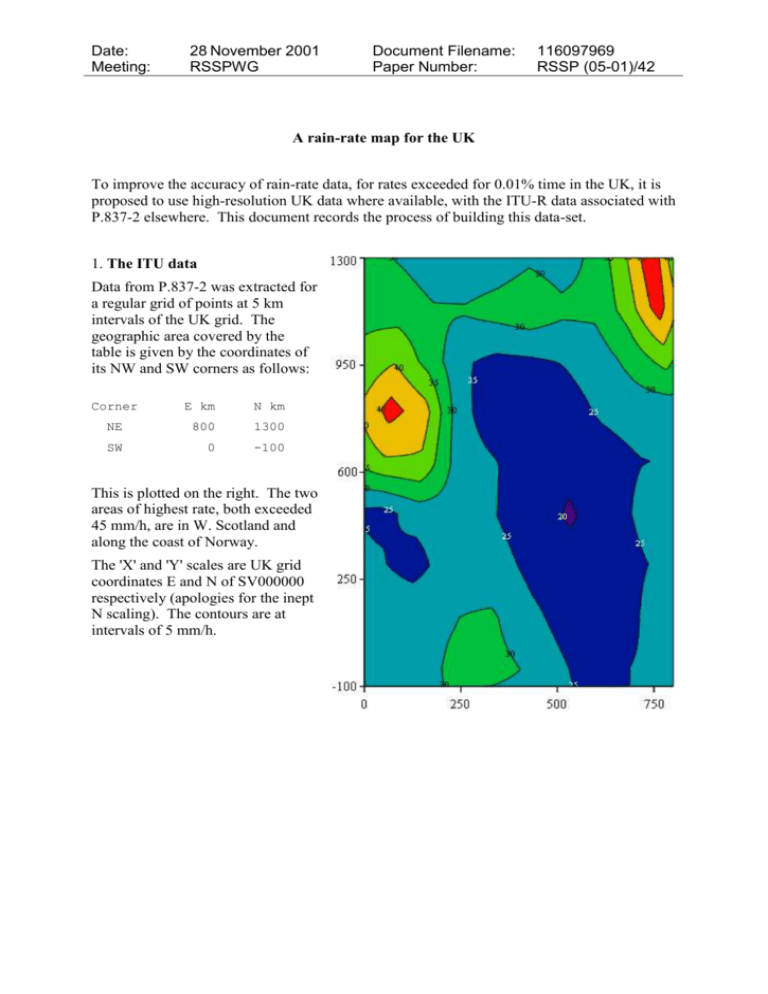
Date: Meeting: 28 November 2001 RSSPWG Document Filename: Paper Number: 116097969 RSSP (05-01)/42 A rain-rate map for the UK To improve the accuracy of rain-rate data, for rates exceeded for 0.01% time in the UK, it is proposed to use high-resolution UK data where available, with the ITU-R data associated with P.837-2 elsewhere. This document records the process of building this data-set. 1. The ITU data Data from P.837-2 was extracted for a regular grid of points at 5 km intervals of the UK grid. The geographic area covered by the table is given by the coordinates of its NW and SW corners as follows: Corner E km N km NE 800 1300 SW 0 -100 This is plotted on the right. The two areas of highest rate, both exceeded 45 mm/h, are in W. Scotland and along the coast of Norway. The 'X' and 'Y' scales are UK grid coordinates E and N of SV000000 respectively (apologies for the inept N scaling). The contours are at intervals of 5 mm/h. 2. The BADC data A table of rain rates for the same UK grid points was extracted from a file supplied by Bath University in which the data were given at intervals of 0.025 degrees of latitude and longitude. A 361 361 array of data was provided, covering a geographic area given by the longitude and latitude of the SW and NE corners as follows: Corner lon deg lat deg NE 2.0 59.0 SW -7.0 50.0 This is plotted on the right. Where the BADC data was not available the rate has been set to zero. Compared to the ITU data, the BADC data provides considerable additional detail in the south and midlands of the UK mainland. It does not show any evidence of the rainfall peak in W Scotland. There are indications on this plot of the artifacts (more evident in the Bath report) roughly along the SE and E coasts. 116097969 printed at 8:20 PM on 12/02/2016 Page 2 of 6 3. Difference between data The plot on the right shows the difference BADC Minus ITU data where BADC data exists. The BADC data gives as much as 20 mm/h less than the ITU data in W Scotland, but up to 20 mm/h more in the SE of England, although this latter maximum is rather close to part of the artifacts mentioned above. 116097969 printed at 8:20 PM on 12/02/2016 Page 3 of 6 4. Combining the data The data were combined by the following processes: The BADC data is used where it exists and is free of artifacts. An interpolation procedure is used to produce a transition region across which the relative proportions of BADC and ITU data are varied linearly. The interpolation zones are defined by a set of straight lines in UK grid coordinates, as illustrated. The lines forming the western limits have been chosen to permit the ITU data showing high rainfall in W.Scotland, which is believed to be realistic, to appear in the final results. The BADC component of the final data will 100% inside the blue lines, and 0% outside the red lines, with a linear transition between them. Where the interpolation zones overlap the smaller of the two BADC proportions is used. The coordinates of the lines are: 45 100 200 1300 W0 400 E1 600 420 0 S0 800 100 260 1300 20 20 0 950 800 950 N1 116097969 95 100 400 1300 W1 500 E0 650 470 0 S1 800 100 1300 70 70 260 0 1000 800 1000 N0 Lines on the west side of the map, defining 0 BADC and 1 BADC Lines on the east side of the map South side North side printed at 8:20 PM on 12/02/2016 Page 4 of 6 5. The UK rain-rate map: The final result shows that the region of high rainfall rate in W Scotland most of the detail in S.E. England have been preserved. Within central UK mainland the BADC data shows its finer structure than the ITU data, and there is now only slight evidence of the BADC artifacts. 116097969 printed at 8:20 PM on 12/02/2016 Page 5 of 6 6 The difference made by the Bath data This diagram shows the difference UK-map minus ITU data, and is thus zero outside the area covered by the BADC data. The two main trends, in addition to the fine detail in the BADC data not found in the ITU data, is that lower rain rates (5 mm/h less in a few places) will be obtained in the W Scotland, and higher rain rates (up to 15 mm/h more) in S.E. England. (The straight-line boundaries of the contour plot on the W and N sides are not discontinuities. They show where linear interpolation towards the BADC data starts. The plot colour changes as soon as zero is exceeded.) 116097969 printed at 8:20 PM on 12/02/2016 Page 6 of 6
