Identification of xylooligosaccharides observed in MALDI-TOF
advertisement
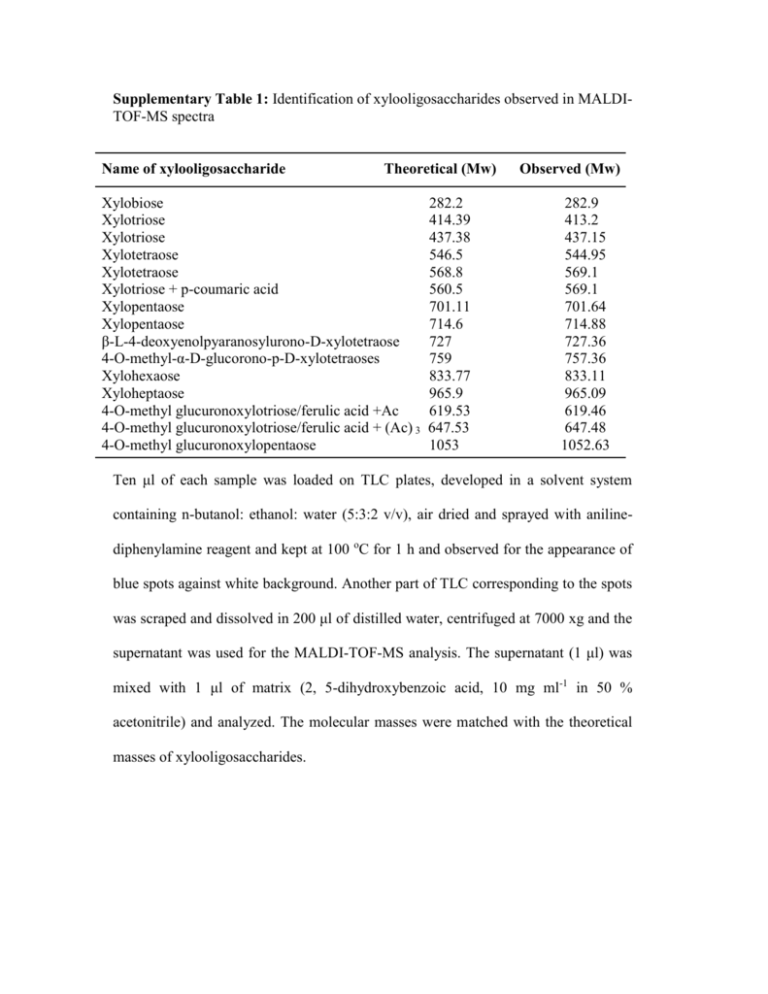
Supplementary Table 1: Identification of xylooligosaccharides observed in MALDITOF-MS spectra Name of xylooligosaccharide Theoretical (Mw) Xylobiose Xylotriose Xylotriose Xylotetraose Xylotetraose Xylotriose + p-coumaric acid Xylopentaose Xylopentaose β-L-4-deoxyenolpyaranosylurono-D-xylotetraose 4-O-methyl-α-D-glucorono-p-D-xylotetraoses Xylohexaose Xyloheptaose 4-O-methyl glucuronoxylotriose/ferulic acid +Ac 4-O-methyl glucuronoxylotriose/ferulic acid + (Ac) 3 4-O-methyl glucuronoxylopentaose 282.2 414.39 437.38 546.5 568.8 560.5 701.11 714.6 727 759 833.77 965.9 619.53 647.53 1053 Observed (Mw) 282.9 413.2 437.15 544.95 569.1 569.1 701.64 714.88 727.36 757.36 833.11 965.09 619.46 647.48 1052.63 Ten μl of each sample was loaded on TLC plates, developed in a solvent system containing n-butanol: ethanol: water (5:3:2 v/v), air dried and sprayed with anilinediphenylamine reagent and kept at 100 oC for 1 h and observed for the appearance of blue spots against white background. Another part of TLC corresponding to the spots was scraped and dissolved in 200 μl of distilled water, centrifuged at 7000 xg and the supernatant was used for the MALDI-TOF-MS analysis. The supernatant (1 μl) was mixed with 1 μl of matrix (2, 5-dihydroxybenzoic acid, 10 mg ml-1 in 50 % acetonitrile) and analyzed. The molecular masses were matched with the theoretical masses of xylooligosaccharides.


