variation between dialysis centre achievement of audit measures for
advertisement
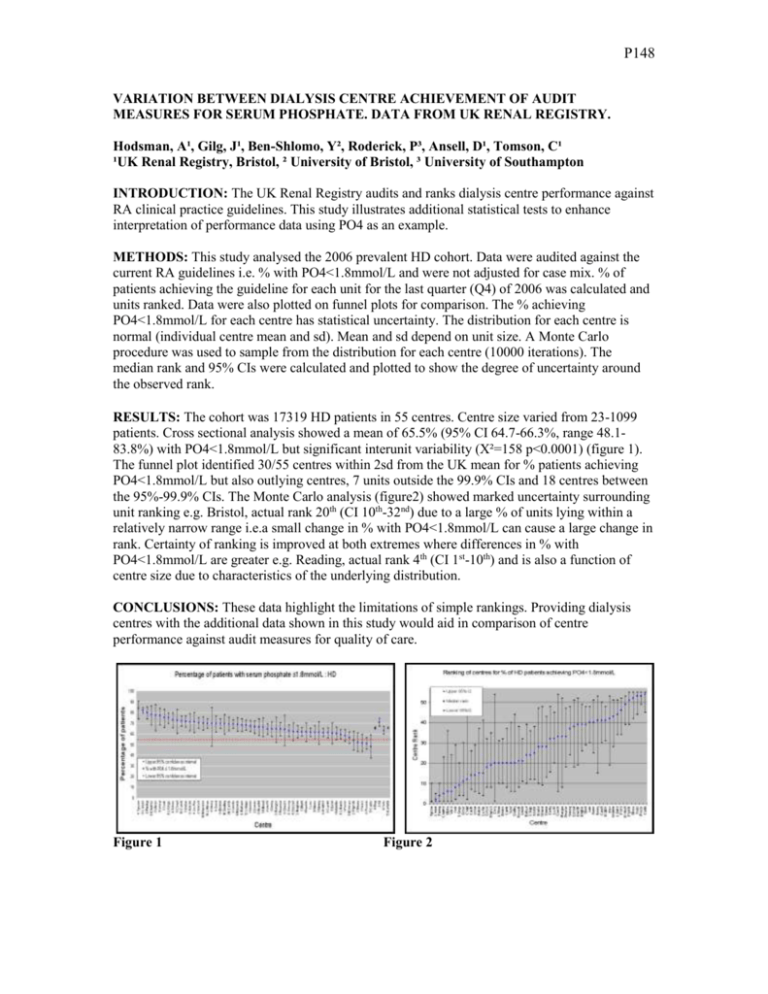
P148 VARIATION BETWEEN DIALYSIS CENTRE ACHIEVEMENT OF AUDIT MEASURES FOR SERUM PHOSPHATE. DATA FROM UK RENAL REGISTRY. Hodsman, A¹, Gilg, J¹, Ben-Shlomo, Y², Roderick, P³, Ansell, D¹, Tomson, C¹ ¹UK Renal Registry, Bristol, ² University of Bristol, ³ University of Southampton INTRODUCTION: The UK Renal Registry audits and ranks dialysis centre performance against RA clinical practice guidelines. This study illustrates additional statistical tests to enhance interpretation of performance data using PO4 as an example. METHODS: This study analysed the 2006 prevalent HD cohort. Data were audited against the current RA guidelines i.e. % with PO4<1.8mmol/L and were not adjusted for case mix. % of patients achieving the guideline for each unit for the last quarter (Q4) of 2006 was calculated and units ranked. Data were also plotted on funnel plots for comparison. The % achieving PO4<1.8mmol/L for each centre has statistical uncertainty. The distribution for each centre is normal (individual centre mean and sd). Mean and sd depend on unit size. A Monte Carlo procedure was used to sample from the distribution for each centre (10000 iterations). The median rank and 95% CIs were calculated and plotted to show the degree of uncertainty around the observed rank. RESULTS: The cohort was 17319 HD patients in 55 centres. Centre size varied from 23-1099 patients. Cross sectional analysis showed a mean of 65.5% (95% CI 64.7-66.3%, range 48.183.8%) with PO4<1.8mmol/L but significant interunit variability (Χ²=158 p<0.0001) (figure 1). The funnel plot identified 30/55 centres within 2sd from the UK mean for % patients achieving PO4<1.8mmol/L but also outlying centres, 7 units outside the 99.9% CIs and 18 centres between the 95%-99.9% CIs. The Monte Carlo analysis (figure2) showed marked uncertainty surrounding unit ranking e.g. Bristol, actual rank 20th (CI 10th-32nd) due to a large % of units lying within a relatively narrow range i.e.a small change in % with PO4<1.8mmol/L can cause a large change in rank. Certainty of ranking is improved at both extremes where differences in % with PO4<1.8mmol/L are greater e.g. Reading, actual rank 4th (CI 1st-10th) and is also a function of centre size due to characteristics of the underlying distribution. CONCLUSIONS: These data highlight the limitations of simple rankings. Providing dialysis centres with the additional data shown in this study would aid in comparison of centre performance against audit measures for quality of care. Figure 1 Figure 2
