HYDROLOGICAL AND BIOGEOCHEMICAL RESPONSES
advertisement
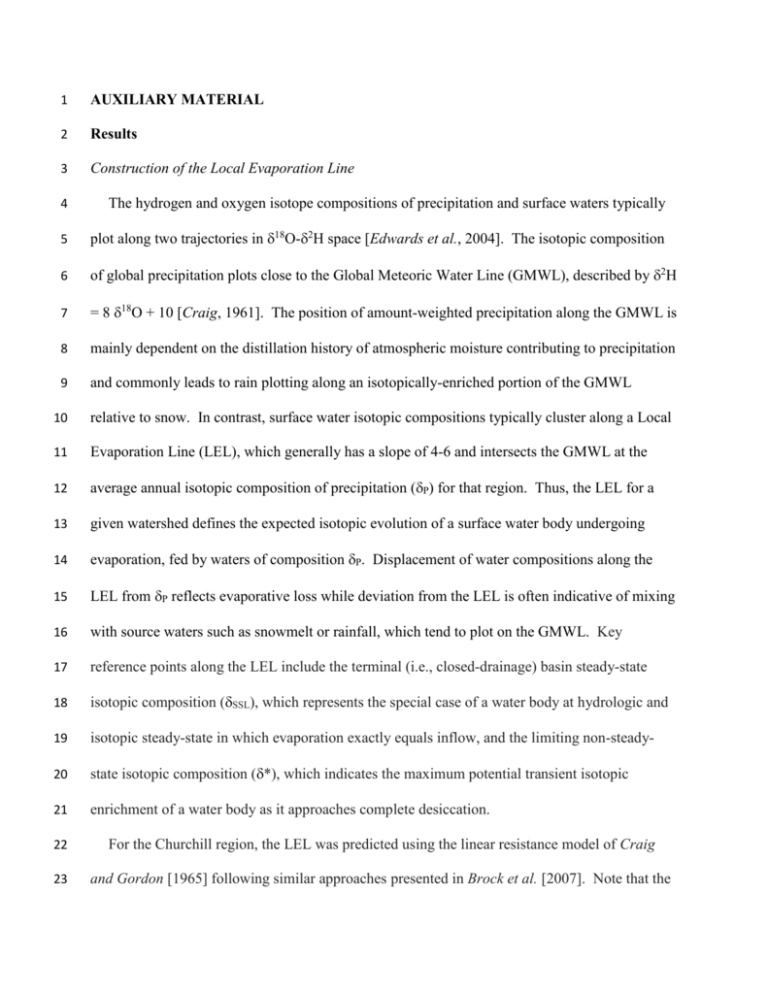
1 AUXILIARY MATERIAL 2 Results 3 Construction of the Local Evaporation Line 4 The hydrogen and oxygen isotope compositions of precipitation and surface waters typically 5 plot along two trajectories in 18O-2H space [Edwards et al., 2004]. The isotopic composition 6 of global precipitation plots close to the Global Meteoric Water Line (GMWL), described by 2H 7 = 8 18O + 10 [Craig, 1961]. The position of amount-weighted precipitation along the GMWL is 8 mainly dependent on the distillation history of atmospheric moisture contributing to precipitation 9 and commonly leads to rain plotting along an isotopically-enriched portion of the GMWL 10 relative to snow. In contrast, surface water isotopic compositions typically cluster along a Local 11 Evaporation Line (LEL), which generally has a slope of 4-6 and intersects the GMWL at the 12 average annual isotopic composition of precipitation (P) for that region. Thus, the LEL for a 13 given watershed defines the expected isotopic evolution of a surface water body undergoing 14 evaporation, fed by waters of composition P. Displacement of water compositions along the 15 LEL from P reflects evaporative loss while deviation from the LEL is often indicative of mixing 16 with source waters such as snowmelt or rainfall, which tend to plot on the GMWL. Key 17 reference points along the LEL include the terminal (i.e., closed-drainage) basin steady-state 18 isotopic composition (SSL), which represents the special case of a water body at hydrologic and 19 isotopic steady-state in which evaporation exactly equals inflow, and the limiting non-steady- 20 state isotopic composition (*), which indicates the maximum potential transient isotopic 21 enrichment of a water body as it approaches complete desiccation. 22 For the Churchill region, the LEL was predicted using the linear resistance model of Craig 23 and Gordon [1965] following similar approaches presented in Brock et al. [2007]. Note that the 24 following equations are expressed in decimal notation. The equilibrium liquid-vapour 25 fractionation factors (α*) for oxygen and hydrogen are dependent on temperature, and have been 26 determined empirically by Horita and Wesolowski [1994], where 27 28 1000lnα* = -7.685 + 6.7123(103/T) - 1.6664(106/T2) + 0.35041(109/T3) (S1) 29 30 for 18O, and 31 32 1000lnα* = 1158.8(T3/109) - 1620.1(T2/106) + 794.84(T/103) - 161.04 + 2.9992(109/T3) (S2) 33 34 for δ2H, where T represents the interface temperature in K. ε* is the temperature-dependent 35 equilibrium separation between liquid and vapour water. ε* is given by 36 37 ε* = α* - 1 (S3) 38 39 and kinetic separation (εK) is expressed by 40 41 εK = CK (1 - h) (S4) 42 43 where constant enrichment values (CK) for oxygen and hydrogen are 0.0142 and 0.0125, 44 respectively, and h is relative humidity [Gonfiantini, 1986]. δAS is the isotopic composition of 45 ambient atmospheric moisture, often assumed to be in isotopic equilibrium with evaporation- 46 flux-weighted local precipitation such that 2 47 48 δAS = (δPS - ε*) / α* (S5) 49 50 The limiting isotopic enrichment of a water body approaching desiccation (δ*) has been defined 51 by Gonfiantini [1986] and can be determined from 52 53 δ* = (hδAS + εK + ε*/α*) / (h - εK - ε*/α*) (S6) 54 55 δSSL represents the isotopic composition of a terminal basin in which evaporation is exactly 56 compensated by inflow, as defined by Gonfiantini [1986]: 57 58 SSL = *I (1 – h + K) + *hAS + *K + * (S7) 59 60 where the isotope composition of inflow, I, is assumed to be equal to P. Results from 61 calculations of the isotope parameters described above are shown in Table S1. 62 63 Sediment core chronologies 64 Total 210Pb activity profiles generally declined with increasing sediment depth and were used 65 to establish the sediment core chronologies (Figure S1). The presence of intact algal mats on the 66 sediment surface of the ponds provides evidence that sediment mixing cannot be the factor 67 producing near-constant total 210Pb concentrations in the upper few cm for all ponds. This 68 feature in the 210Pb profiles may indicate recent increases in sedimentation rates. Despite recent 69 observations of desiccation at Puddle Pond, there are no artifacts in the 210Pb profile that would 3 70 suggest discontinuous sedimentation. The sediment core was collected at a location that 71 contained a thin film of water and, as the water isotope data demonstrate, is replenished in the 72 spring. Evidently, spring inflow is sufficient to support aquatic production and the preservation 73 of a continuous sediment record. Sediment ages to ~1850 C.E. were calculated using the 74 Constant Rate of Supply (CRS) model [Appleby, 2001] and then were extrapolated down core. 75 Thus, there is greater uncertainty for the pre-1850 sediment core chronologies. 76 Loss-on-ignition [LOI; Dean, 1974] profiles were generated to compare stratigraphic records 77 from the paired sediment cores from each study pond (Figure S2). Similar records were 78 produced for paired cores from Left and Erin ponds, and therefore the chronologies established 79 for the 210Pb-dated cores were directly transferred to the cores analyzed for cellulose oxygen 80 isotope composition. Establishing the chronology for the cores from Larch and Puddle ponds 81 analyzed for cellulose oxygen isotope composition required incorporating a slight stratigraphic 82 offset evident between the two LOI profiles (Figure S2). For Larch Pond, this was accomplished 83 by transferring the dates for the 210Pb-dated core at 10.5 cm (1927) and at 9.5 cm (1943) to the 84 corresponding depths for the non-210Pb-dated core (8.5 and 7.0 cm, respectively). Linear 85 interpolation was used to re-calculate the sedimentation rates between the surface of the core 86 (2009) and 7.0 cm depth (1943) and between 7.0 cm (1943) and 8.5 cm depth (1927). The latter 87 sedimentation rate was used for the interval below 8.5 cm. For Puddle Pond, the chronology for 88 the core analyzed for cellulose oxygen isotope composition was determined by transferring the 89 dates for the 210Pb-dated core at 25.0 cm (1830) and at 19.5 cm (1897) to the corresponding 90 depths for the non-210Pb-dated core (27.0 and 22.0 cm, respectively). Linear interpolation was 91 used to re-calculate the sedimentation rates between the surface of the core (2009) and 22.0 cm 92 depth (1897) and between 22.0 cm (1897) and 27.0 cm depth (1830). The latter sedimentation 4 93 rate was used for the interval below 27.0 cm. Figure S1 displays the depth-age relations for both 94 the Larch Pond and Puddle Pond cores directly dated using 210Pb and for the cores analyzed for 95 cellulose oxygen isotope composition. 5 96 Tables 97 Table S1. All values used to calculate the Local Evaporation Line for Churchill, Manitoba. Term Definition Value Reference 9oC T Flux-weighted temperature (climate normal, 1971-2000) Flux-weighted relative humidity (climate normal, 1971-2000) 77.1% H Equilibrium liquid-vapour fractionation factor (18O, 2H) Kinetic separation (18O, 2H) Equilibrium separation (18O, 2H) Limiting isotope enrichment of a water body approaching complete desiccation (δ18O, δ2H) Steady-state isotope composition of a terminal basin (δ18O, δ2H) Isotope composition of ambient atmospheric moisture (δ18O, δ2H) Isotope composition of precipitation (δ18O, δ2H) 1.0108, 1.0984 Environment Canada (http://climate.weatheroffice.gc.ca/; Churchill Airport station) Environment Canada (http://climate.weatheroffice.gc.ca/; Churchill Airport station) Equations (S1) and (S2) 3.3, 2.8 10.8, 98.4 -4.5‰, -54‰ Equation (S4) Equation (S3) Equation (S6) -7.5‰, -73‰ Equation (S7) -22.6‰, -168‰ Equation (S5) (fitted to pond water isotope data; see Light [2011]) Churchill CNIP station K * * δSSL δAS δP -17.2‰, -129‰ 98 6 99 Figures 100 101 Figure S1. Total and supported 210Pb (mean 214Bi and/or 214Pb) activity profiles, and depth-age 102 relations for sediment cores obtained from Left, Larch, Erin and Puddle ponds. 103 104 Figure S2. Loss-on-ignition profiles for sediment cores obtained from Left, Larch, Erin and 105 Puddle ponds. Cores on the left of each pair were analyzed for 210Pb; cores on the right of each 106 pair were analyzed for cellulose oxygen isotope composition. 7 107 References 108 Appleby, P.G. (2001), Chronostratigraphic techniques in recent sediments, in Tracking 109 Environmental Change Using Lake Sediments: Basin Analysis, Coring, and Chronological 110 Techniques, Developments in Paleoenvironmental Research, vol. 1, edited by W.M. Last and J.P. 111 Smol, pp. 171-203, Kluwer Academic Publishers, Dordrecht. 112 113 Brock B.E., B.B. Wolfe and T.W.D. Edwards (2007), Characterizing the hydrology of shallow 114 floodplain lakes in the Slave River Delta, NWT, using water isotope tracers, Arctic Ant. Alp. 115 Res., 39, 388-401. 116 117 Craig, H. (1961), Isotopic variations in meteoric waters, Science, 133, 1702-1703. 118 119 Craig, H. and L.I. Gordon (1965), Deuterium and oxygen 18 variations in the ocean and the 120 marine atmosphere, in Stable Isotope in Oceanographic Studies and Paleotemperatures, edited 121 by E. Tongiorgi, pp. 9-130, Laboratorio di Geologia Nucleare, Pisa, Italy. 122 123 Dean, W.E. (1974), Determination of carbonate and organic matter in calcareous sediments and 124 sedimentary rocks by loss on ignition: comparison with other methods, J. Sed. Petrol., 44, 242- 125 248. 126 127 Edwards, T.W.D., B.B. Wolfe, J.J. Gibson and D. Hammarlund (2004), Use of water isotope 128 tracers in high-latitude hydrology and paleohydrology, in Long-Term Environmental Change in 8 129 Arctic and Antarctic Lakes, Developments in Paleoenvironmental Research, vol. 7, edited by R. 130 Pienitz, M. Douglas and J.P. Smol, pp. 187-207, Springer, Dordrecht. 131 132 Gonfiantini, R. (1986), Environmental isotopes in lake studies, in Handbook of Environmental 133 Isotope Geochemistry, The Terrestrial Environment, vol. 2, edited by P. Fritz and J.-C. Fontes, 134 pp. 113-168, Elsevier, New York. 135 136 Horita, J. and D. Wesolowski (1994), Liquid-vapour fractionation of oxygen and hydrogen 137 isotopes of water from the freezing to the critical temperature, Geochim. Cosmochim. Acta, 58, 138 3425-3437. 139 140 Light, E. (2011), Characterizing the present and past hydrology of shallow ponds in the Churchill 141 area using isotopic methods, MSc thesis, Wilfrid Laurier Univ., Waterloo, Ont., Canada. 9
