Mass Spectrum – Interpretation
advertisement
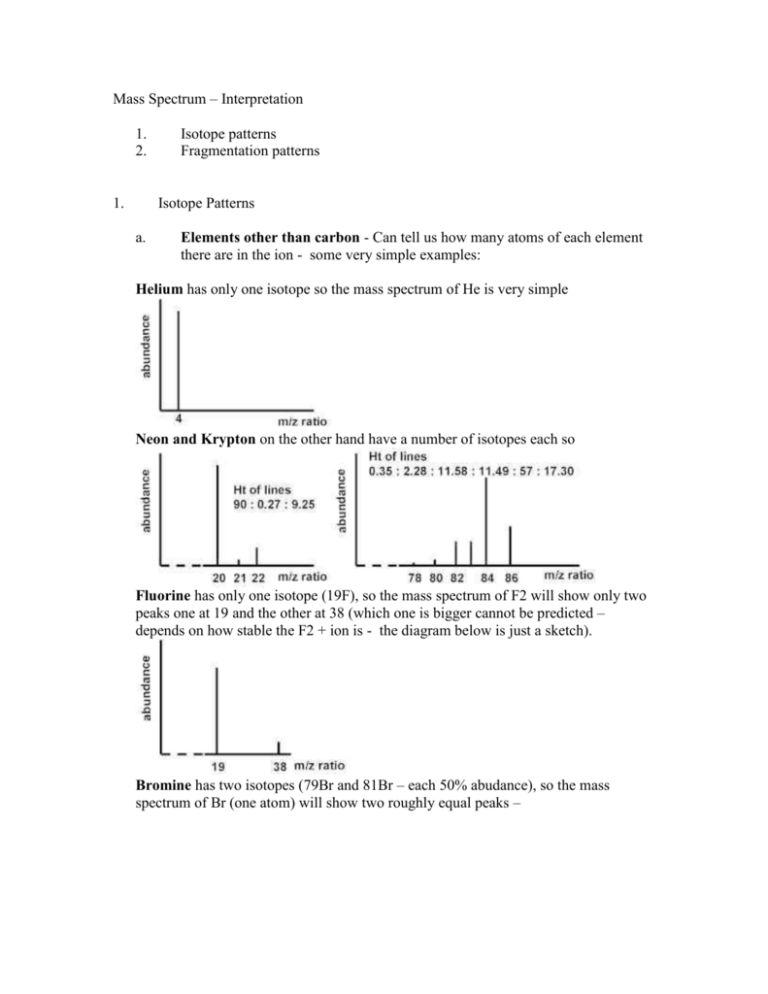
Mass Spectrum – Interpretation 1. 2. 1. Isotope patterns Fragmentation patterns Isotope Patterns a. Elements other than carbon - Can tell us how many atoms of each element there are in the ion - some very simple examples: Helium has only one isotope so the mass spectrum of He is very simple Neon and Krypton on the other hand have a number of isotopes each so Fluorine has only one isotope (19F), so the mass spectrum of F2 will show only two peaks one at 19 and the other at 38 (which one is bigger cannot be predicted – depends on how stable the F2 + ion is - the diagram below is just a sketch). Bromine has two isotopes (79Br and 81Br – each 50% abudance), so the mass spectrum of Br (one atom) will show two roughly equal peaks – The mass spectrum of Br2 – if we just look at the molecular ion – i.e. the Br2 region Because you have 79Br-79Br, 81Br-79Br and 81Br-81Br – and if you work out the probablities this is what you would expect. Extending this to other molecules we can tell e.g. There are actually software programmes on the Internet which will simulate isotope ratios for more complicated molecules e.g. if it contains Br, Cl and S b. Carbon There is a useful rule for carbon – The reason for this is that the little peak 1 amu away from the main peak represents the ion where one of the carbons has been substituted with 13C. See worked examples in the power points on C6H6, C6H5Br, CH4 and CHBr
