Supplementary Content for “Regime Transition in Electromechanical
advertisement
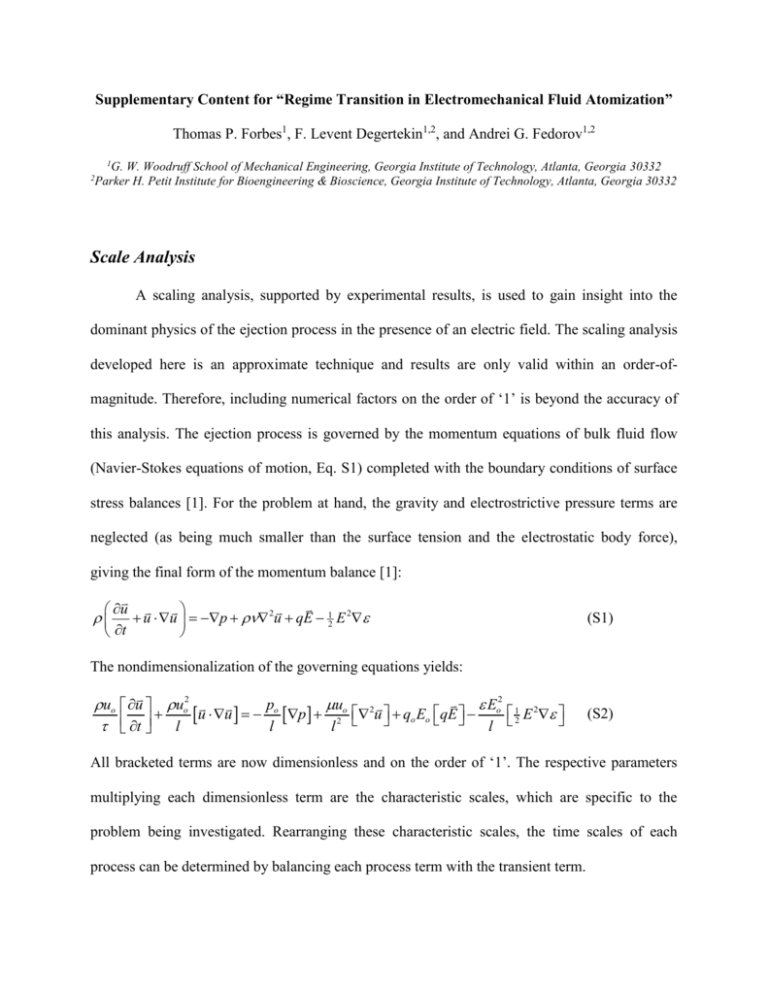
Supplementary Content for “Regime Transition in Electromechanical Fluid Atomization” Thomas P. Forbes1, F. Levent Degertekin1,2, and Andrei G. Fedorov1,2 1 G. W. Woodruff School of Mechanical Engineering, Georgia Institute of Technology, Atlanta, Georgia 30332 Parker H. Petit Institute for Bioengineering & Bioscience, Georgia Institute of Technology, Atlanta, Georgia 30332 2 Scale Analysis A scaling analysis, supported by experimental results, is used to gain insight into the dominant physics of the ejection process in the presence of an electric field. The scaling analysis developed here is an approximate technique and results are only valid within an order-ofmagnitude. Therefore, including numerical factors on the order of ‘1’ is beyond the accuracy of this analysis. The ejection process is governed by the momentum equations of bulk fluid flow (Navier-Stokes equations of motion, Eq. S1) completed with the boundary conditions of surface stress balances [1]. For the problem at hand, the gravity and electrostrictive pressure terms are neglected (as being much smaller than the surface tension and the electrostatic body force), giving the final form of the momentum balance [1]: u u u p 2u qE 12 E 2 t (S1) The nondimensionalization of the governing equations yields: uo 2 po uo 2 Eo2 1 2 u uo E u u p u q E qE o o t l l l2 l 2 (S2) All bracketed terms are now dimensionless and on the order of ‘1’. The respective parameters multiplying each dimensionless term are the characteristic scales, which are specific to the problem being investigated. Rearranging these characteristic scales, the time scales of each process can be determined by balancing each process term with the transient term. po qo Eo Eo2 1 2 1 u uo 2 E qE u u p 2 u t l uol l uo uo l 2 (S3) For the AMUSE ion source, the fluid inertia is driven by the time-varying sinusoidal pressure field, therefore the dynamic pressure is the appropriate characteristic scale for the pressure, po ~ uo2 . Equation S3 yields the following time scales: process time scale t p ~ 1 f , inertia time scale tu ~ l uo , viscous time scale t ~ l 2 , Coulombic time scale tc ~ l qo Eo , and dielectric time scale td ~ l 2 Eo2 . The characteristic length scale is defined as the radius of the nozzle orifice and the process time scale is again dictated by the periodicity of the ejection process, or the inverse of the frequency. Experimental Setup The atomization setup and electrode arrangement for locally applying an electric field are shown in Figure S1 and have been adopted from [1-2]. Stroboscopic visualization is used to gain an insight into the microscopic structure of atomized spray [3]. The high-spatial-resolution stroboscopic imaging technique is employed by focusing on electrolyte ejection from a single nozzle orifice which is illuminated with high intensity light (using a light-emitting diode LED), pulsed at the same frequency as that driving ejection. The short exposure time due to pulsed LED operation, synchronized with ejection, enables capturing and recording of still images of atomization by a charge-coupled device (CCD) camera, linked to a computer and image processor (Figure S2). This technique, which can be traced back to Lord Rayleigh’s original work [4-6], provides still images of the periodic ejection process, “frozen” in space/time. Figure S1. Schematic representation of the AMUSE ion source and externally-applied electric field configuration. Experiments are conducted using aqueous (deionized water, Ricca Chemical Company, Arlington, Texas, USA) solutions containing 0.1% and 1% (v/v) glacial acetic acid (BDH Aristar, Westchester, PA, USA) (pH 3.25 and 2.76, respectively). A schematic of the experimental setup used for the stroboscopic visualization experiments is shown in Figure S2. The piezoelectric transducer is driven at a resonant frequency of the fluid reservoir by an amplified (T&C Power Conversion RF Amplifier) RF signal, generated by a Stanford Research Systems DS345 30MHz (or Agilent 33250A) function generator labeled “Function Generator 1”. All respective signals are monitored with the use of a Tektronix TDS 2014 oscilloscope. An LED, operated at the same frequency as the piezoelectric drive signal, is used to illuminate droplet ejection from a single nozzle. The LED is driven using an Agilent 33250A function generator (Agilent Technologies, Inc., Model 33250A 80MHz) labeled “Function Generator 2”, which is externally triggered by Function Generator 1 so that both piezoelectric drive signal and the LED pulse are at the same frequency (Figure S2). Function Generator 2 produces a pulsed signal, whose width and delay are controlled by the user. For the frequencies of operation considered here (~ 0.5–1.5 MHz), the LED is pulsed with a 100 nanosecond pulse width. This method illuminates the same time instant in each cycle of ejection effectively “freezing” the image. Each captured image is the superposition of thousands of images, all captured at the same point in each ejection cycle while the camera shutter is open (32 ms). Figure S2. Schematic representation of the experimental setup for stroboscopic visualization of the electrolyte ejection process under the application of an external electric field. The image collection and control over the LED pulse delay is managed through a National Instruments LabVIEW [7] virtual instrument. The LED is best positioned providing backlighting to the droplet stream. The ejector is located on a three-axis stage to move the field of view of the camera. The CCD camera (Redlake MASD, Inc., Model MegaPlus ES 1.0) with adjustable magnification lenses (200-1400X) has a focal length of ~1-1.5 inches and is maintained at a 30º inclination angle with respect to the nozzle array surface. The CCD camera output is directly connected to a computer with a National Instruments image acquisition module (National Instruments, Model 1422 Digital IMAQ). References 1. Forbes, T.P.; Degertekin, F.L.; Fedorov, A.G. Electrohydrodynamics of Charge Separation in Droplet-Based Ion Sources with Time-Varying Electrical and Mechanical Actuation. J. Am. Soc. Mass Spectrom. 2010, 21, 501-510. 2. Forbes, T.P.; Dixon, R.B.; Muddiman, D.C.; Degertekin, F.L.; Fedorov, A.G. Characterization of Charge Separation in the Array of Micromachined UltraSonic Electrospray (AMUSE) Ion Source for Mass Spectrometry. J. Am. Soc. Mass Spectrom. 2009, 20(9), 1684-1687. 3. Meacham, J.M.; Varady, M.J.; Degertekin, F.L.; Fedorov, A.G. Droplet formation and ejection from a micromachined ultrasonic droplet generator: Visualization and scaling. Phys. Fluids. 2005, 17(10), 100605-100608. 4. Rayleigh, L.J.W.S. On the capillary phenomena of jets. Proc. R. Soc. London. 1879, 29, 71-97. 5. Rayleigh, L.J.W.S. Further observations upon liquid jets, in continuation of those recorded in the Royal Society's 'Proceedings' for March and May 1879. Proc. R. Soc. London. 1882, 34, 130145. 6. Rayleigh, L.J.W.S. Some applications of photography. Nature. 1891, 44, 249-254. 7. National Instruments LabVIEW version 7.0. 2006,
