Supplemental Material
advertisement
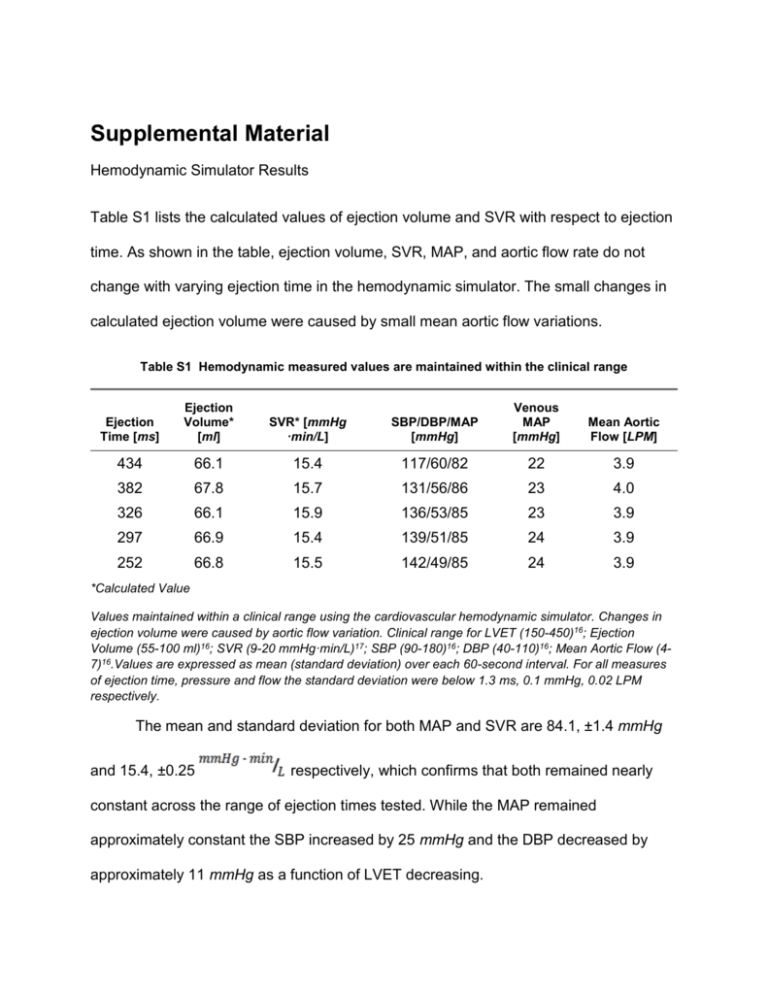
Supplemental Material Hemodynamic Simulator Results Table S1 lists the calculated values of ejection volume and SVR with respect to ejection time. As shown in the table, ejection volume, SVR, MAP, and aortic flow rate do not change with varying ejection time in the hemodynamic simulator. The small changes in calculated ejection volume were caused by small mean aortic flow variations. Table S1 Hemodynamic measured values are maintained within the clinical range Ejection Time [ms] Ejection Volume* [ml] SVR* [mmHg ·min/L] SBP/DBP/MAP [mmHg] Venous MAP [mmHg] Mean Aortic Flow [LPM] 434 66.1 15.4 117/60/82 22 3.9 382 67.8 15.7 131/56/86 23 4.0 326 66.1 15.9 136/53/85 23 3.9 297 66.9 15.4 139/51/85 24 3.9 252 66.8 15.5 142/49/85 24 3.9 *Calculated Value Values maintained within a clinical range using the cardiovascular hemodynamic simulator. Changes in ejection volume were caused by aortic flow variation. Clinical range for LVET (150-450)16; Ejection Volume (55-100 ml)16; SVR (9-20 mmHg·min/L)17; SBP (90-180)16; DBP (40-110)16; Mean Aortic Flow (47)16.Values are expressed as mean (standard deviation) over each 60-second interval. For all measures of ejection time, pressure and flow the standard deviation were below 1.3 ms, 0.1 mmHg, 0.02 LPM respectively. The mean and standard deviation for both MAP and SVR are 84.1, ±1.4 mmHg and 15.4, ±0.25 respectively, which confirms that both remained nearly constant across the range of ejection times tested. While the MAP remained approximately constant the SBP increased by 25 mmHg and the DBP decreased by approximately 11 mmHg as a function of LVET decreasing. As can be seen in Table S1 across the range of ejection times, the associated DBP changed from approximately 60-49 mmHg, for a constant SVR and MAP. In our experiment, no adjustments were made across the five steps of decreasing ejection time. Since the ejection time decreased while heart rate and ejection volume remained constant, the time spent in diastole increased and thus resulted in a decreasing DBP. The opposite effect is observed for SBP, which increases from 117-144 mmHg as ejection time decreases. The observed changes for both SBP and DBP are consistent with those observed clinically with changes in ejection time,16 but are on the low side of clinical relevance. Increases in flow rate would have further increased the effect on PWV as can be seen by equation (16). Elastance Contour Plot Figure S1 Elastance contour plot for fixed ejection volume (66 ml) and peak pressure (140 mmHg). The model calculated a 1.04 MPa elastic modulus based on the measured peak pressure, ejection time and PWV. The three annotated red diamonds are the model results using measurements taken at ejection times (252, 297, 326). Each of these ejection times had a measured peak pressure of ~140 mmHg. 2 Comparison of Model to Extracted Clinical Data Figure S2. Extracted clinical data (squares)16 of PWV vs intra-arterial blood pressure for a 19-year-old female (left) and a 58-year-old female (right) obtained during surgery.Sweeping the model across the range of possible ejection times and volumes (Table S1 footnote) results in the gray region. The solid line represents the best-fit pressure PWV curve for each patient. To compare the model to the extracted clinical data (19 year old female, Figure S2 left; and 58 year old female, Figure S2 right), cMK was estimated from the zero crossing of an extension of the fitting curve presented in Ref. [7]; cMK was ~4.8 m/s and ~5.2 m/s for S2 left and right, respectively. The radii for the 19 year old and 58 year old patient were selected based on age as 12.2 mm and 15 mm respectively.26 The wall thickness and blood density were kept constant at2.0 mm and 1025kg/m 3 respectively.26 Using these values we calculated the resulting E0 using equation (11). The per-patient constant ‘a’ was adjusted to closely fit the individual’s PWV versus pressure response, which is likely dominated by the dynamic elasticity of the aorta. In both cases, the altered variables were maintained within the clinical range.16,17 Since ejection volume and time were not measured in the referenced study, the PWV versus pressure relationship was estimated based on the ranges identified in the footnote of Table S1. Differences in flow velocity (as determined from ejection time and volume) potentially 3 account for the measured scatter in the PWV versus pressure data points. The model demonstrates the correct curvature, and the expected range (gray) based on flow velocity encompasses most of the measured data points. Data points outside of the expected range could be due to surgically induced changes in ejection time and volume beyond the range assumed for healthy individuals. 4
