American Chemical Society - Springer Static Content Server
advertisement
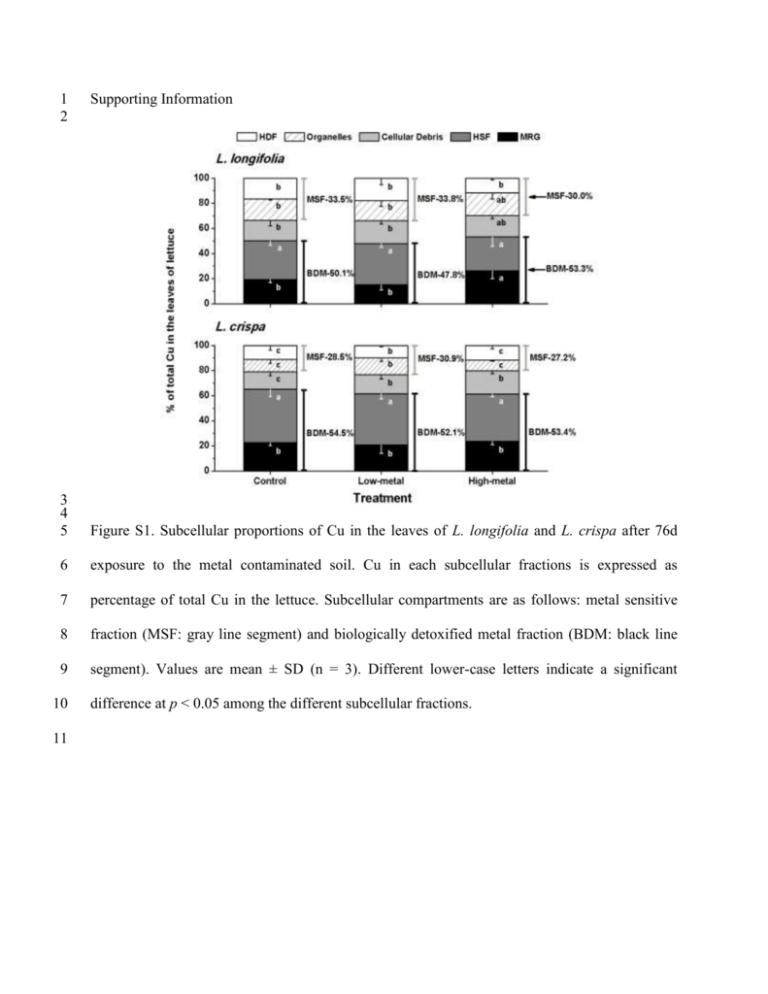
1 2 Supporting Information 3 4 5 Figure S1. Subcellular proportions of Cu in the leaves of L. longifolia and L. crispa after 76d 6 exposure to the metal contaminated soil. Cu in each subcellular fractions is expressed as 7 percentage of total Cu in the lettuce. Subcellular compartments are as follows: metal sensitive 8 fraction (MSF: gray line segment) and biologically detoxified metal fraction (BDM: black line 9 segment). Values are mean ± SD (n = 3). Different lower-case letters indicate a significant 10 11 difference at p < 0.05 among the different subcellular fractions. 12 13 14 Figure S2. Chemical forms proportions of Cu in the leaves of L. longifolia and L. crispa after 15 76d exposure to the metal contaminated soil. Copper in each chemical forms is expressed as 16 percentage of total Cu in the lettuce. Copper in different chemical forms are as follows: F(i): 17 inorganic Cu extracted by 80% ethanol, F(ii): water soluble Cu extracted by deionized water, 18 F(iii): pectate- and protein-integrated Cu extracted by 1 M NaCl, F(iv): phosphate Cu extracted 19 by 2% HAc, F(v): oxalate Cu extracted by 0.6 M HCl, F(vi) : Cu in residues. Values are mean ± 20 SD (n = 3). Different upper-case letters indicate a significant difference at p < 0.05 among the 21 different soil treatments; different lower-case letters indicate a significant difference at p < 0.05 22 among the different chemical forms. * (p < 0.05) and ** (p < 0.01) indicate a significant 23 difference between proportions of Cu in the leaves of L. longifolia and those in L. crispa. 24 25 26 27 Figure S3. Relationships between Cd proportions in subcellular fractions and those in chemical 28 forms fractions.
