Investigating Protein Stability with the Optical Tweezer I. Introduction
advertisement
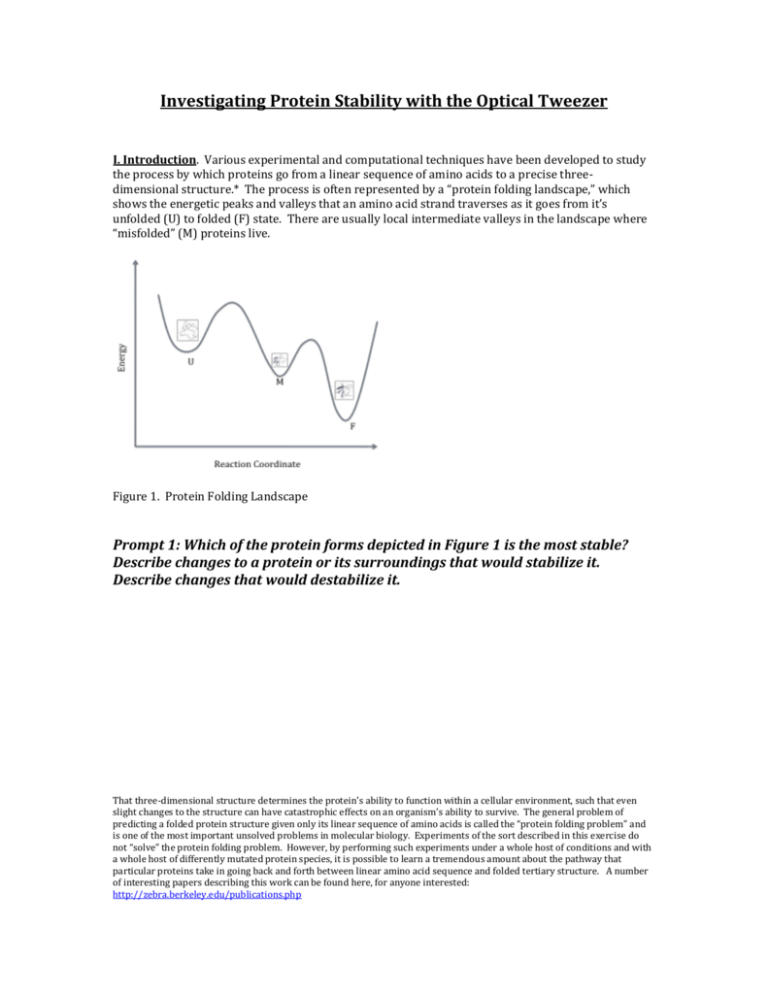
Investigating Protein Stability with the Optical Tweezer I. Introduction. Various experimental and computational techniques have been developed to study the process by which proteins go from a linear sequence of amino acids to a precise threedimensional structure.* The process is often represented by a “protein folding landscape,” which shows the energetic peaks and valleys that an amino acid strand traverses as it goes from it’s unfolded (U) to folded (F) state. There are usually local intermediate valleys in the landscape where “misfolded” (M) proteins live. Figure 1. Protein Folding Landscape Prompt 1: Which of the protein forms depicted in Figure 1 is the most stable? Describe changes to a protein or its surroundings that would stabilize it. Describe changes that would destabilize it. That three-dimensional structure determines the protein’s ability to function within a cellular environment, such that even slight changes to the structure can have catastrophic effects on an organism’s ability to survive. The general problem of predicting a folded protein structure given only its linear sequence of amino acids is called the “protein folding problem” and is one of the most important unsolved problems in molecular biology. Experiments of the sort described in this exercise do not “solve” the protein folding problem. However, by performing such experiments under a whole host of conditions and with a whole host of differently mutated protein species, it is possible to learn a tremendous amount about the pathway that particular proteins take in going back and forth between linear amino acid sequence and folded tertiary structure. A number of interesting papers describing this work can be found here, for anyone interested: http://zebra.berkeley.edu/publications.php II. Making Predictions. Imagine that we mutate the amino acid sequence of RNase H, so that one alanine somewhere in its sequence is replaced by a lysine. This change, while seemingly small, serves to destabilize the folded protein structure, i.e., it makes its folder form higher in energy than the un-mutated species. Let’s think for a moment about how that destabilized, mutated protein will behave under the conditions imposed by the optical tweezer. Prompt 2: Do you expect the work required of the tweezers to unfold the mutated RNase H to be less or more than that required to unfold the wild-type RNase H. Why? Prompt 3: Do you expect the force at which the unfolding occurs to be smaller or larger in the mutated case than it is in the wild-type (un-mutated) RNase H? (BONUS! Do you think it is possible to mutate the RNase H in a way that stabilizes the protein relative to its wild-type form, i.e., in a way which lowers its energy?) Prompt 4: If one does work on a protein with the tweezers, where does the added energy go? III. Looking at the Data. The data obtained when force is applied to the system shown in Figure 2 is given in Figure 3 below. Figure 3. Data obtained when RNase H is explored via the optical tweezer set-up described above. The “extension” in Figure 3 refers to the distance between the two beads in the experimental set-up, and the red line represents a theoretical prediction of what would be seen if no protein were present. Focus on the black curve, which shows what happens experimentally when RNase H is attached to the DNA linkers as in Figure 2. Prompt 5: Focusing on the black curve in Figure 2, draw a physical picture that represents what might be happening to the protein and its DNA handles (a) when the applied force is between 0 and 15 pN, (b) when the applied force is about 15 pN, and (c) when the applied force is greater than 15 pN. Explain how your pictures correspond to the different regions on the plot. The really interesting behavior occurs when the tweezer has applied a force of about 15 pN. Here, we see a sudden increase in the distance between the two beads, and we interpret that event to be the “unfolding” of the RNase H protein. Protein unfolding events often occur in multiple steps and can be far more complicated than the single-step unfolding process shown in Figure 3. Prompt 6: Draw a protein folding energy landscape for RNase H that is consistent with the force-vs-extension data shown in Figure 3. Prompt 7: How could you use the data in Figure 3 to quantify the amount by which the unfolded RNase H is destabilized relative to the folded form? Where is this value represented on the protein folding energy landscape? Prompt 8: Draw a Force-vs-Extension curve that one would expect to see if one used the optical tweezers to pull on the protein represented by the protein folding landscape depicted in Figure 1. APPENDIX: DNA AS A BIOLOGICAL SPRING. Experimental Set-up. If someone asked you to measure the spring constant k for a DNA molecule, how might you do so? Well, as with any spring, you’d probably like to be able to pick it up and tug on it, to see how much force you must apply in order to stretch it a certain distance. This would give you a sense of how taught or tense the spring is, and therefore a sense of its spring constant. Unfortunately, a single DNA molecule is tiny, so we can’t just go to the bathroom cabinet and get a pair of everyday tweezers to pick it up. We must devise a more clever tweezer! The diagram below presents the key features of one such clever device, the “optical tweezer.” Later in the course we may have the chance to discuss this set-up in more detail, but for now don’t worry too much about all of the intricacies. The important thing to know right now is that one end of the DNA molecule is chemically attached to a small polystyrene bead (the bead’s radius is about 10-6 m), which is “trapped” in space by one or more laser beams. (If the bead were not trapped, it would just float haphazardly around the fluid in which the experiment takes place, making it almost impossible to study.) The other end of the DNA molecule is fixed in place either by attaching it to a surface, as shown in the figure, or by using a second bead that is also trapped in space in some way. Figure 1. DNA Manipulation Experiment Using Optical Tweezers. Since the bead is trapped in the center of the laser beam (called the beam’s “focus”), it moves as the focus moves. Why the bead moves with the focus of the beam is not at all obvious… stay tuned for a discussion later in the course! If you move the laser focus to the right, the bead goes with it. By moving the focus of the beam ever so slightly, we can begin to stretch the DNA. Moving the focus of the beam just a few nanometers to the right causes the DNA to be stretched by a measurable force, and we can begin to construct a plot of the bead’s position as a function of the applied force. Estimating the dsDNA spring constant. When optical stweezer experiments are performed on double-stranded DNA (dsDNA), data of the following form are obtained (the horizontal axis is labeled in micrometers, 10-6 m, and the vetical axis in picoNewtons, 10-12 N). “Extension” refers to the length beyond the length DNA would have if it were relaxed, i.e., if it were not being stretched by the optical tweezer. Figure 2. Stretching dsDNA. The “B-form” dsDNA is the type that most often exists under normal physiological conditions in the cell. Clearly, DNA is not an ideal spring obeying Hooke’s Law – it is more complicated than that. A model that more accurately describes the behavior of dsDNA as a whole must itself be much more complicated (for example: http://en.wikipedia.org/wiki/Worm-like_chain). Nevertheless, that does not mean that the model is useless. What is happening in each region of the data? When the force is first applied the DNA is loosely coiled like a strand of spaghetti, so those first few pN of force serve only to uncoil or straighten the chain into a linear piece of doublex helix DNA. Then, during the steep part of the curve between a few pN to 6, d5 pN, the DNA is stretched, slightly deforming the hydrogen bonded base pairs until, at about 65 pN, a cooperative transition occurs in which those hydrogen bonds holding the base pairs together are broken and the DNA loses it’s helical integrity.
