Using the national TopNet model to estimate flood magnitude
advertisement

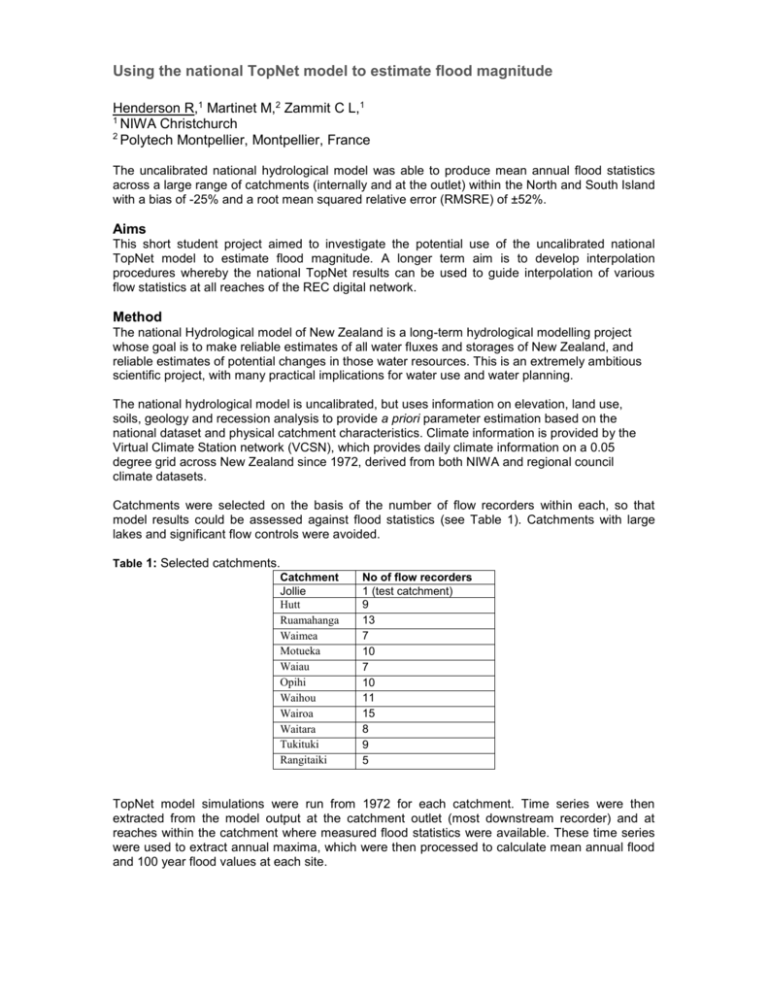
Using the national TopNet model to estimate flood magnitude Henderson R,1 Martinet M,2 Zammit C L,1 1 NIWA Christchurch 2 Polytech Montpellier, Montpellier, France The uncalibrated national hydrological model was able to produce mean annual flood statistics across a large range of catchments (internally and at the outlet) within the North and South Island with a bias of -25% and a root mean squared relative error (RMSRE) of ±52%. Aims This short student project aimed to investigate the potential use of the uncalibrated national TopNet model to estimate flood magnitude. A longer term aim is to develop interpolation procedures whereby the national TopNet results can be used to guide interpolation of various flow statistics at all reaches of the REC digital network. Method The national Hydrological model of New Zealand is a long-term hydrological modelling project whose goal is to make reliable estimates of all water fluxes and storages of New Zealand, and reliable estimates of potential changes in those water resources. This is an extremely ambitious scientific project, with many practical implications for water use and water planning. The national hydrological model is uncalibrated, but uses information on elevation, land use, soils, geology and recession analysis to provide a priori parameter estimation based on the national dataset and physical catchment characteristics. Climate information is provided by the Virtual Climate Station network (VCSN), which provides daily climate information on a 0.05 degree grid across New Zealand since 1972, derived from both NIWA and regional council climate datasets. Catchments were selected on the basis of the number of flow recorders within each, so that model results could be assessed against flood statistics (see Table 1). Catchments with large lakes and significant flow controls were avoided. Table 1: Selected catchments. Catchment Jollie Hutt Ruamahanga Waimea Motueka Waiau Opihi Waihou Wairoa Waitara Tukituki Rangitaiki No of flow recorders 1 (test catchment) 9 13 7 10 7 10 11 15 8 9 5 TopNet model simulations were run from 1972 for each catchment. Time series were then extracted from the model output at the catchment outlet (most downstream recorder) and at reaches within the catchment where measured flood statistics were available. These time series were used to extract annual maxima, which were then processed to calculate mean annual flood and 100 year flood values at each site. Results Initial results are promising as shown in Figure 1. Bias of -25% is partly explained by the use of Virtual Climate Station Network rain as input, because of the 5 km grid spacing and daily timestep of the fundamental data. RMSRE of 52% is comparable to the recent check on the McKerchar and Pearson flood intensity contours with the updated flood dataset (see Henderson and Collins presentation at this meeting). Figure 1: Mean annual flood values, modelled vs. at site data. In future the national hydrological model could be used to analyse flood generation mechanisms and associated statistics across a range of landscape, soil land use and climate conditions. References HENDERSON, R.D. and COLLINS, D. B. G. 2015. An Updated Regional Flood Frequency for New Zealand. Oral presentation at this meeting. MCKERCHAR, A. I. & PEARSON, C. P. 1989. Flood Frequency in New Zealand. Publication No. 20 of the Hydrology Centre. Christchurch, N.Z.: DSIR Division of Water Sciences.


