Solution Set - Cloudfront.net
advertisement
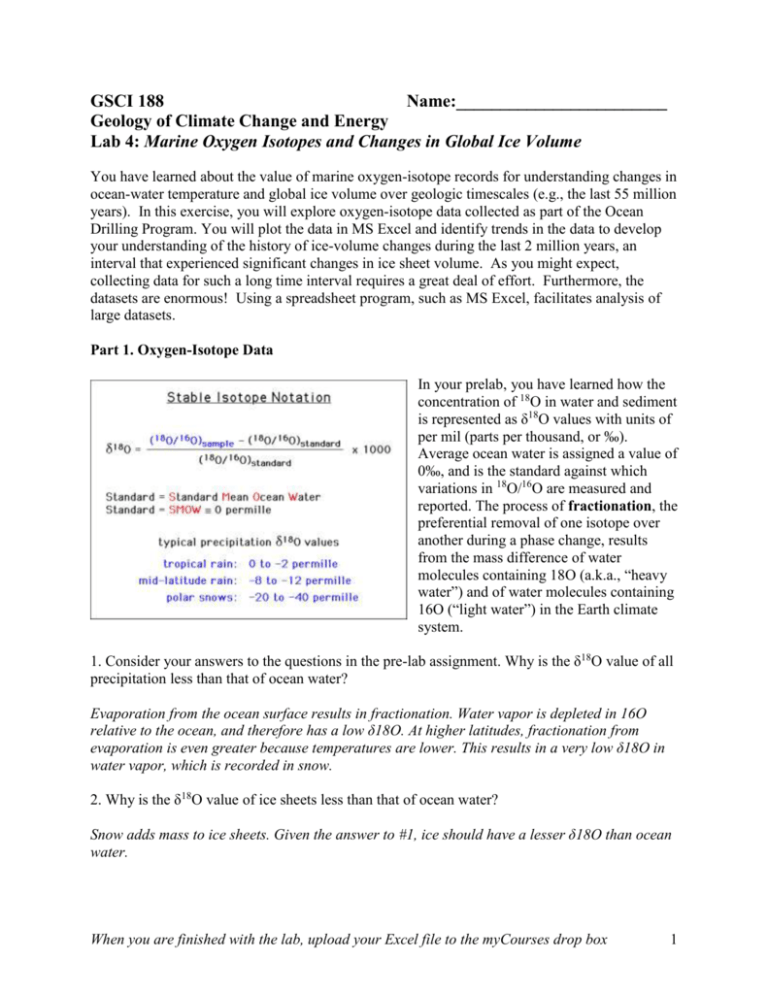
GSCI 188 Name:________________________ Geology of Climate Change and Energy Lab 4: Marine Oxygen Isotopes and Changes in Global Ice Volume You have learned about the value of marine oxygen-isotope records for understanding changes in ocean-water temperature and global ice volume over geologic timescales (e.g., the last 55 million years). In this exercise, you will explore oxygen-isotope data collected as part of the Ocean Drilling Program. You will plot the data in MS Excel and identify trends in the data to develop your understanding of the history of ice-volume changes during the last 2 million years, an interval that experienced significant changes in ice sheet volume. As you might expect, collecting data for such a long time interval requires a great deal of effort. Furthermore, the datasets are enormous! Using a spreadsheet program, such as MS Excel, facilitates analysis of large datasets. Part 1. Oxygen-Isotope Data In your prelab, you have learned how the concentration of 18O in water and sediment is represented as δ18O values with units of per mil (parts per thousand, or ‰). Average ocean water is assigned a value of 0‰, and is the standard against which variations in 18O/16O are measured and reported. The process of fractionation, the preferential removal of one isotope over another during a phase change, results from the mass difference of water molecules containing 18O (a.k.a., “heavy water”) and of water molecules containing 16O (“light water”) in the Earth climate system. 1. Consider your answers to the questions in the pre-lab assignment. Why is the δ18O value of all precipitation less than that of ocean water? Evaporation from the ocean surface results in fractionation. Water vapor is depleted in 16O relative to the ocean, and therefore has a low δ18O. At higher latitudes, fractionation from evaporation is even greater because temperatures are lower. This results in a very low δ18O in water vapor, which is recorded in snow. 2. Why is the δ18O value of ice sheets less than that of ocean water? Snow adds mass to ice sheets. Given the answer to #1, ice should have a lesser δ18O than ocean water. When you are finished with the lab, upload your Excel file to the myCourses drop box 1 Part 2. Plotting marine oxygen-isotope data in Excel. Step 1. View the source of the data. Using a web browser, connect to NOAA's Paleoclimatology Program Homepage (a Google search will take you to this). This website provides links to the datasets used by climate scientists to understand the history of climate change, or paleoclimatology. A. From there, go to Paleocean. This page includes a search engine, from which scientists can explore the types of data available for studying paleoceanography, information about changes in the ocean over geologic time scales. Select the Paleoceanography Search Engine. When you arrive at the Search Engine page, type "odp" into the space for "Site", and click the search button. ODP stands for the Ocean Drilling Program, which was a U.S.-sponsored program aimed at extracting paleoclimatic information from the oceans through the retrieval of long cores of deep marine sediment. B. Scroll down to ODP677. This represents site 677 of the ODP, where an ocean drilling platform was used to retrieve a core of deep marine sediment. Click on “Astronomical Timescale for the lower Pleistocene”; this should open a text file in your web browser. 3. Read the text file you created on the website. Where was ODP core 677 retrieved? What was the water depth? The tropical Pacific (Latitude: 1.12.00N, Longitude:83.44.00 W, Water Depth(m): 3450 4. What type of sediment forms in this water depth? For the upper two meters of the core, approximately how many years are represented by 10 cm of sediment? Deep marine sediment fine-grained sediment. The upper 2 m of sediment represent 32,000 years. 200/32000 = 0.0063 cm/year. 10 cm of sediment represents (10 cm/(0.0063 cm/yr) = 1600 years. 5. How thick is ODP core 677? How much geologic time is represented by the entire core? Core is 11190 cm, 111.90 m thick. About 2.6 million years are represented in the core. 6. What do oxygen isotope data from planktic and benthic forams indicate about climate? Oxygen isotopes of planktic (floaters) indicate sea-surface temperature, whereas oxygen isotopes of benthic (bottom dwellers) indicate changes in ice volume. When you are finished with the lab, upload your Excel file to the myCourses drop box 2 Step 2. Organize the data. Access the data from this text file is available in your lab section of myCourses. Go to Course Materials Files for Lab 4 ODP667 data. Open the Excel worksheet and save a copy to your computer. A. The Excel worksheet does not include all of the data you viewed in the text file. Instead, it displays only the data for fossils of benthic foraminifers, Uvig and Uvigorid. Recall from question #6 that δ18O values from benthic foraminifer fossils provide an indication of global ice volume. That is, δ18O is an index of the size of ice sheets. B. Insert a new column between columns B and C, and enter the heading “sample age (kyr)”. Compute ages of each sample in thousands of years. Below the heading, enter the equation “=b2/1000”. Copy and paste this equation downward to all cells in the column. Step 3. Plot the data. Create an X-Y plot of δ18O (on the y-axis) as a function of age (on the xaxis) for the past 2 million years. A. Be sure to use the Scatter Plot option with straight lines, no point markers. B. The title of the plot should be " δ18O benthics (uvig.) ODP 677". The name for the x-axis should be "Age (kyr)", and the name for the y-axis should be " δ18O (‰)". Make the plot a separate page in your Excel worksheet. C. The Y-axis should have a minimum value of 3 (not the default which is 0) and a maximum value of 5.5, and the X-axis should have a maximum value of 2000 kyr. Display the values on the Y-axis in reverse order. You now have a neat plot of δ18O variations at ODP site 677 as a function of time over the past 2 million years. D. Repeat the plotting procedure to make three new graphs. One for the time interval 2 million to 1 million years ago, one for the past 500,000 years, and one for the past 150,000 years. Part 3. Interpreting the Data 7. What do intervals of high δ18O values represent? What do intervals of low δ18O values represent? High δ18O represent periods of greater ice volume, low represent periods of less ice volume. 8. What is the range through which δ18O values fluctuate between 2 million and 1 million years ago? Between 500 kyr ago and the present? 3.3 to 4.7 per mil for 2 to 1 Ma, 3.4 to about 5.3 for 1 Ma to present. When you are finished with the lab, upload your Excel file to the myCourses drop box 3 9. What does your answer to #8 indicate about the magnitude of the change in global ice volume during these two intervals? The magnitude of global ice volume change was greater during the past million years than during the previous million years. 10. Based on this δ18O record, intervals of greatest ice volume and least ice volume have been identified. Intervals of greatest ice volume are termed glaciations, whereas intervals of least ice volume are termed interglaciations. Because the marine δ18O is so useful for understanding ice volume changes, climate scientists have designated isotope stages, with odd-number stages representing glaciations and even-number stages representing glaciations. The duration of stages is given in the table below. According to this table, when was the last glaciation? How long did it last? Marine Oxygen Isotope Stage 1 2 3 4 5 6 7 8 9 10 11 12 Age interval (kyr ago) 0-12 12-24 24-59 59-71 71-128 128-186 186-245 245-303 303-359 359-362 362-423 423-478 The last glaciation was 24-12 ka (the Late Wisconsin glaciation). 11. Use the drawing tools in Excel to draw vertical lines on your graph to represent the boundaries between the isotope stages. Add the lines to your graph showing the δ18O record of the past 500 kyr. See supporting materials on the SERC website, or contact the authors. 12. Of the isotope stages shown above/on your graph, four display the greatest ice volume. What stages are these? Stage 2, Stage 6, Stage 9 (early), Stage 11 (early) When you are finished with the lab, upload your Excel file to the myCourses drop box 4 13. Identify the four lowest δ18O values on the curve over the past 500 kyr. During what stages do these occur? Stage 5, Stage 7, Stage 9 (middle), Stage 11 (early) 14. Climate scientists can also take a broader view of ice volume changes, by considering the long term trends in the δ18O curve. Consider the graph displaying the past 150 kyr of the curve. How many years of overall ice growth occur between the minimum δ18O value during isotope stage 5 and the maximum during isotope stage 2? 93 kyr 15. Now, consider the decline in δ18O values that occurs near the boundaries of isotope stages 6/5 and 2/1. How many years of ice decay occur at these two boundaries? About 22 kyr at the 6/5 boundary, about 11 kyr at the 2/1 boundary (although data set is incomplete) 16. Based on your knowledge of the processes by which ice sheets grow and decay, explain the difference in duration of periods of ice sheet growth and ice sheet decay. Accumulation of perennial snow during periods of ice sheet growth is slow compared to melting and other processes of ablation that dominate during periods of ice sheet decay. 17. Given your answer to question #16, do you believe that the current trend of ice sheet melting in Greenland and Antarctica is of immediate concern? Explain your answer. Answers will vary. If students recognize that ice sheet decay can occur much faster than ice sheet growth, this may prompt some concern. When you are finished with the lab, upload your Excel file to the myCourses drop box 5
