14:00-15:30 Lab session on RELATE and model matrices
advertisement
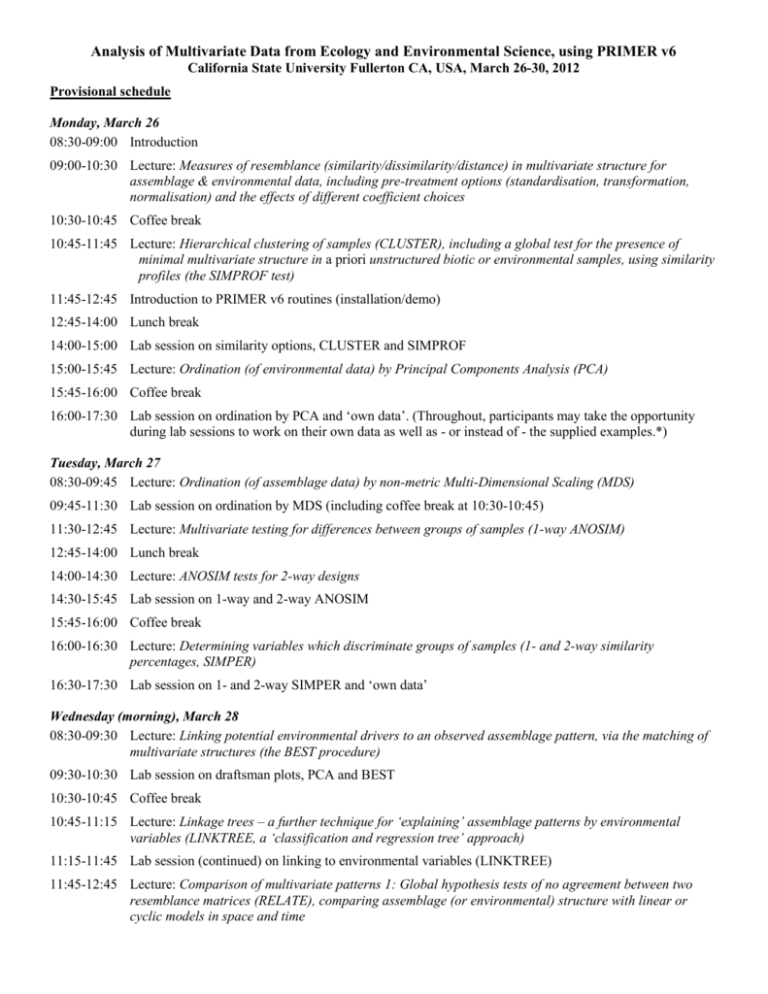
Analysis of Multivariate Data from Ecology and Environmental Science, using PRIMER v6 California State University Fullerton CA, USA, March 26-30, 2012 Provisional schedule Monday, March 26 08:30-09:00 Introduction 09:00-10:30 Lecture: Measures of resemblance (similarity/dissimilarity/distance) in multivariate structure for assemblage & environmental data, including pre-treatment options (standardisation, transformation, normalisation) and the effects of different coefficient choices 10:30-10:45 Coffee break 10:45-11:45 Lecture: Hierarchical clustering of samples (CLUSTER), including a global test for the presence of minimal multivariate structure in a priori unstructured biotic or environmental samples, using similarity profiles (the SIMPROF test) 11:45-12:45 Introduction to PRIMER v6 routines (installation/demo) 12:45-14:00 Lunch break 14:00-15:00 Lab session on similarity options, CLUSTER and SIMPROF 15:00-15:45 Lecture: Ordination (of environmental data) by Principal Components Analysis (PCA) 15:45-16:00 Coffee break 16:00-17:30 Lab session on ordination by PCA and ‘own data’. (Throughout, participants may take the opportunity during lab sessions to work on their own data as well as - or instead of - the supplied examples.*) Tuesday, March 27 08:30-09:45 Lecture: Ordination (of assemblage data) by non-metric Multi-Dimensional Scaling (MDS) 09:45-11:30 Lab session on ordination by MDS (including coffee break at 10:30-10:45) 11:30-12:45 Lecture: Multivariate testing for differences between groups of samples (1-way ANOSIM) 12:45-14:00 Lunch break 14:00-14:30 Lecture: ANOSIM tests for 2-way designs 14:30-15:45 Lab session on 1-way and 2-way ANOSIM 15:45-16:00 Coffee break 16:00-16:30 Lecture: Determining variables which discriminate groups of samples (1- and 2-way similarity percentages, SIMPER) 16:30-17:30 Lab session on 1- and 2-way SIMPER and ‘own data’ Wednesday (morning), March 28 08:30-09:30 Lecture: Linking potential environmental drivers to an observed assemblage pattern, via the matching of multivariate structures (the BEST procedure) 09:30-10:30 Lab session on draftsman plots, PCA and BEST 10:30-10:45 Coffee break 10:45-11:15 Lecture: Linkage trees – a further technique for ‘explaining’ assemblage patterns by environmental variables (LINKTREE, a ‘classification and regression tree’ approach) 11:15-11:45 Lab session (continued) on linking to environmental variables (LINKTREE) 11:45-12:45 Lecture: Comparison of multivariate patterns 1: Global hypothesis tests of no agreement between two resemblance matrices (RELATE), comparing assemblage (or environmental) structure with linear or cyclic models in space and time Wednesday (afternoon), March 28 12:45-14:00 Lunch break 14:00-15:30 Lab session on RELATE and model matrices 15:30-15:45 Lecture: Comparison of multivariate patterns 2: Test of no evidence for a biota-environment link, allowing for the selection effects in finding an optimum match (the global BEST test) 15:45-16:00 Coffee break 16:00-16:45 Lecture: Comparison of multivariate patterns 3: Stepwise form of the BEST routine, e.g. for finding species subsets determining overall assemblage pattern 16:45-17:30 Lab session on global BEST test and using BEST for species selection Thursday, March 29 08:30-09:30 Lecture: Diversity measures (DIVERSE) and comments on sampling properties and multivariate treatment of multiple indices. Dominance plots and tests for differences between sets of curves (DOMDIS) 09:30-10:30 Lab session on DIVERSE, dominance plots and testing sets of curves (DOMDIS) 10:30-10:45 Coffee break 10:45-12:00 Lecture: Taxonomic (or phylogenetic) diversity and distinctness for quantitative data, or simple species lists, as valid biodiversity measures (DIVERSE) over broad spatial and temporal scales; sampling properties and testing structures (TAXDTEST) 12:00-12:45 Lab session on TAXDTEST 12:45-14:00 Lunch break 14:00-15:00 Demonstration of the PERMANOVA+ add-on package to PRIMER, for analysing more complex designs 15:00-17:30 Lab session on ‘own data’ (coffee break at 15:45-16:00) Friday, March 30 08:30-09:30 Lecture: Comparison of multivariate patterns 4: Second-stage analysis (2STAGE) to compare taxonomic levels and transformation or coefficient choices; also for a possible testing framework in some repeated measures designs 09:30-10:30 Lab session on 2STAGE 10:30-10:45 Coffee break 10:45-11:45 Lecture: Further resemblance options: dispersion weighting to downweight counts from clumped species; modifying Bray-Curtis for denuded samples; dissimilarity measures based on taxonomic distinctness, and other miscellaneous topics (e.g. EM algorithm for missing environmental data) 11:45-12:45 Lab session on further tests & resemblance measures (Dispersion weighting, Zero-adjusted Bray-Curtis, 2STAGE for similarities etc) 12:45-14:00 Lunch break 14:00-17:00 Lab session on analysing own data using PRIMER (coffee break at 15:45-16:00) ____________________________________________________________________________________________________________ * Throughout, participants will be given real data sets to analyse, but they may also wish to bring their own data. These should be in numeric, rectangular arrays, with variables (e.g. species) as rows, samples as columns, or vice-versa, in an Excel spreadsheet or text file. Non-numeric sets of information (factors) on each sample are placed below (or to the side of) this table, separated by a blank row (or blank column). There is also a 3-column format (sample label, variable label, non-zero entry) suitable for very large arrays.

![저기요[jeo-gi-yo] - WordPress.com](http://s2.studylib.net/store/data/005572742_1-676dcc06fe6d6aaa8f3ba5da35df9fe7-300x300.png)

