Teacher support: Environmental control of
advertisement
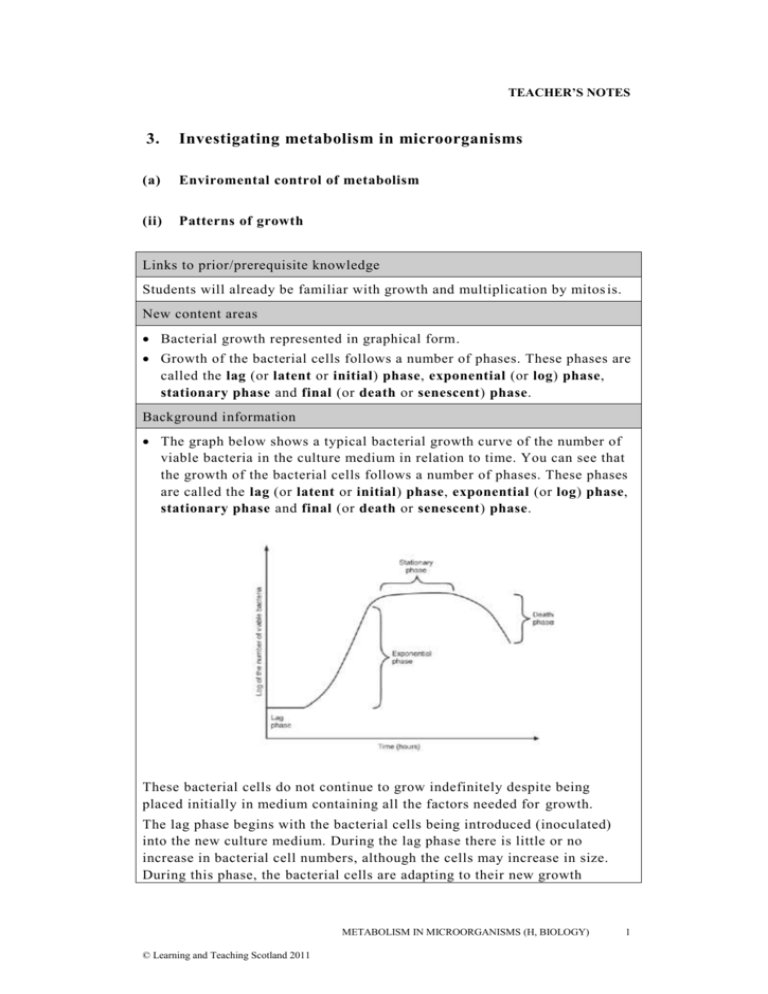
TEACHER’S NOTES 3. Investigating metabolism in microorganisms (a) Enviromental control of metabolism (ii) Patterns of growth Links to prior/prerequisite knowledge Students will already be familiar with growth and multiplication by mitos is. New content areas Bacterial growth represented in graphical form. Growth of the bacterial cells follows a number of phases. These phases are called the lag (or latent or initial) phase, exponential (or log) phase, stationary phase and final (or death or senescent) phase. Background information The graph below shows a typical bacterial growth curve of the number of viable bacteria in the culture medium in relation to time. You can see that the growth of the bacterial cells follows a number of phases. These phases are called the lag (or latent or initial) phase, exponential (or log) phase, stationary phase and final (or death or senescent) phase. These bacterial cells do not continue to grow indefinitely despite being placed initially in medium containing all the factors needed for growth. The lag phase begins with the bacterial cells being introduced (inoculated) into the new culture medium. During the lag phase there is little or no increase in bacterial cell numbers, although the cells may increase in size. During this phase, the bacterial cells are adapting to their new growth METABOLISM IN MICROORGANISMS (H, BIOLOGY) © Learning and Teaching Scotland 2011 1 TEACHER’S NOTES conditions, for example by producing enzymes to process the nutrients present in the growth medium. During the exponential phase the bacterial cells double at a constant rate. The actual time that the bacteria take to double depends on the culture medium and the temperature. The time taken for the numbers of bacterial cells to double is called the doubling rate. It is the exponential phase that is the most suitable phase for carrying out experiments to find out growth rates and to investigate the factors that affect growth. In the stationary phase there is no increase in the number of viable bacterial cells. The number of new cells being produced is equivalent to the number of bacterial cells that are dying. During this phase there is no further increase in bacterial cell growth because the available nutrients are starting to be used up. Also, conditions such as pH may have altered to such an extent that they are now inhibiting the growth of the bacteria. During the death phase the bacterial cells die due to starvation and/or adverse environmental conditions. SAPS growth rate activity pdf Identification of key concepts Draw the general shape of a bacterial growth curve . Name the phases observed in the growth curve. Describe the events that occur in each phase of the growth curve. Identification of particular areas of difficulty Related problem-solving type tasks such as graph drawing, cell count calculations. Links to websites, animations, PowerPoints, audio or video files etc http://www.ryancshaw.com/Files/micro/Animations/BacterialGrowth/PLAY_ bacterial_growth.html http://www.youtube.com/watch?v=SuvGpMevLPU Other useful information to stimulate interest http://www.ltscotland.org.uk/Images/microbiologyhunit 1_tcm4-134104.pdf 2 METABOLISM IN MICROORGANISMS (H, BIOLOGY) © Learning and Teaching Scotland 2011


