Entropy production on biotic and abiotic surfaces
advertisement
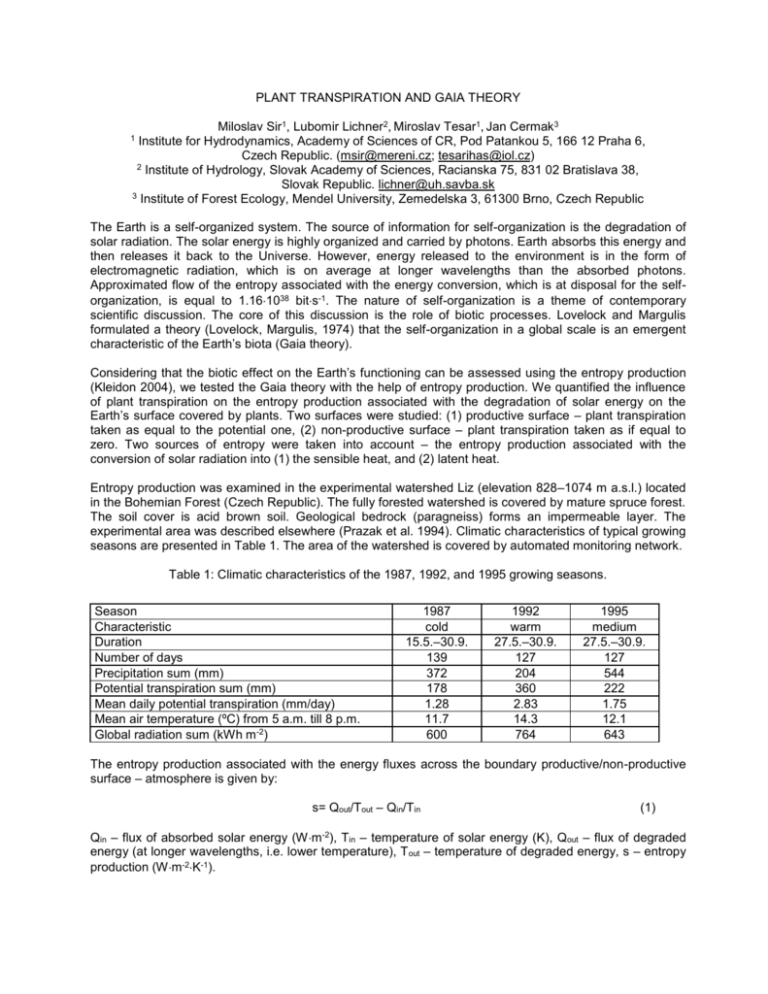
PLANT TRANSPIRATION AND GAIA THEORY Miloslav Sir1, Lubomir Lichner2, Miroslav Tesar1, Jan Cermak3 Institute for Hydrodynamics, Academy of Sciences of CR, Pod Patankou 5, 166 12 Praha 6, Czech Republic. (msir@mereni.cz; tesarihas@iol.cz) 2 Institute of Hydrology, Slovak Academy of Sciences, Racianska 75, 831 02 Bratislava 38, Slovak Republic. lichner@uh.savba.sk 3 Institute of Forest Ecology, Mendel University, Zemedelska 3, 61300 Brno, Czech Republic 1 The Earth is a self-organized system. The source of information for self-organization is the degradation of solar radiation. The solar energy is highly organized and carried by photons. Earth absorbs this energy and then releases it back to the Universe. However, energy released to the environment is in the form of electromagnetic radiation, which is on average at longer wavelengths than the absorbed photons. Approximated flow of the entropy associated with the energy conversion, which is at disposal for the selforganization, is equal to 1.161038 bits-1. The nature of self-organization is a theme of contemporary scientific discussion. The core of this discussion is the role of biotic processes. Lovelock and Margulis formulated a theory (Lovelock, Margulis, 1974) that the self-organization in a global scale is an emergent characteristic of the Earth’s biota (Gaia theory). Considering that the biotic effect on the Earth’s functioning can be assessed using the entropy production (Kleidon 2004), we tested the Gaia theory with the help of entropy production. We quantified the influence of plant transpiration on the entropy production associated with the degradation of solar energy on the Earth’s surface covered by plants. Two surfaces were studied: (1) productive surface – plant transpiration taken as equal to the potential one, (2) non-productive surface – plant transpiration taken as if equal to zero. Two sources of entropy were taken into account – the entropy production associated with the conversion of solar radiation into (1) the sensible heat, and (2) latent heat. Entropy production was examined in the experimental watershed Liz (elevation 828–1074 m a.s.l.) located in the Bohemian Forest (Czech Republic). The fully forested watershed is covered by mature spruce forest. The soil cover is acid brown soil. Geological bedrock (paragneiss) forms an impermeable layer. The experimental area was described elsewhere (Prazak et al. 1994). Climatic characteristics of typical growing seasons are presented in Table 1. The area of the watershed is covered by automated monitoring network. Table 1: Climatic characteristics of the 1987, 1992, and 1995 growing seasons. Season Characteristic Duration Number of days Precipitation sum (mm) Potential transpiration sum (mm) Mean daily potential transpiration (mm/day) Mean air temperature (ºC) from 5 a.m. till 8 p.m. Global radiation sum (kWh m-2) 1987 cold 15.5.–30.9. 139 372 178 1.28 11.7 600 1992 warm 27.5.–30.9. 127 204 360 2.83 14.3 764 1995 medium 27.5.–30.9. 127 544 222 1.75 12.1 643 The entropy production associated with the energy fluxes across the boundary productive/non-productive surface – atmosphere is given by: s= Qout/Tout – Qin/Tin (1) Qin – flux of absorbed solar energy (Wm-2), Tin – temperature of solar energy (K), Qout – flux of degraded energy (at longer wavelengths, i.e. lower temperature), T out – temperature of degraded energy, s – entropy production (Wm-2K-1). Equation (1) can be directly used for the quantification of the entropy production associated with the conversion of solar radiation in the sensible heat. Plant cover absorbs solar radiation Q in at the radiative temperature of the Sun Tin = 5760 K and immediately reemits the sensible heat Qout at a temperature Tout (approx. equal to the leaf temperature). This means that both processes – energy absorption and emission – are local and synchronous. The entropy production associated with the conversion of solar radiation in the latent heat can be similarly solved. In this case, T in is the radiative temperature of the Sun and Tout is the air temperature. This approach includes some inconsistency because the evaporation and subsequent condensation obviously are not local and synchronous processes. A model of plant cooling (Prazak et al., 1994) was used for calculations of the temporal course of potential transpiration, latent and sensible heat fluxes, and the time course of plant surface temperature in the vegetation season 1992. This model was parameterized using optimum temperature and albedo which are characteristics of the vegetation cover. Meteorological data serving as an input represented the time courses of air temperature and global radiation. Input data were routinely measured in meteorological stations. The model parameters have a clear physical meaning and can be experimentally evaluated. Output data can be directly compared to measured data in experimental watersheds. Because of the model parameters, both inputs and outputs can be measured, the model can be validated in any natural conditions by comparing measured and calculated data. This validation has been done for a series of experimental catchments in the Czech Republic including the Liz catchment. In the 1992 growing season (Tab. 1) the entropy production in the Liz catchment was quantified in arid and humid hydrologic cycles with the help of eq. (1). The arid hydrologic cycle represented a situation when in 39 % of days the Earth’s surface was productive, in 61 % of days was non-productive, i.e. plant transpiration was equal to zero. The humid hydrologic cycle represented a situation when plant transpiration was equal to the potential one. Sensible heat flux, latent heat flux and surface temperature were calculated using the model of plant cooling (Prazak et al., 1994). The value of optimum temperature was 25 ºC in the case of the biotic surface. The same values of global radiation, air temperature, and albedo were used for calculations in humid and arid cycle. We found that in the growing season 1992 the entropy production in humid hydrologic cycle was considerably higher than in the arid one. Considering that the biotic effect on the Earth’s functioning can be assessed using the entropy production (Kleidon 2004), we can assume that the theory that biota – represented as a productive surface – regulates Earth’s environment is proved in the watershed scale. Thus the Gaia theory – biotic effects increase the entropy production – is proved in the studied example. The solar illumination as a cause of self-organizing processes by evaporation of water from leaf parenchyma was proved in the article Tributsch et al. (2005) at the micro-scale of water molecules. Dissipation of solar energy in landscape – controlled by management of water and vegetation – was identified as a cause of the ecosystem control at the global scale (Ripl 1995, Pokorny 2001). It was proved in the article by Sir et al. (2004) that the natural selection of plant cover tends to produce the maximum amount of phytomass. At the global scale, this would imply subsequently that the entropy production across the boundary of Earth’s surface – atmosphere is maximized and the entropy of mass accumulated on the Earth’s surface is minimised if the surface is productive. References Kleidon, A. 2004. Climatic Change 66: 271–319. Lovelock, J. E., Margulis, L. 1974. Tellus, 26: 2–10. Pokorny, J. 2000. Renewable Energy 24: 641–645. Prazak, J., Sir, M., Tesar, M. 1994. J. Hydrol. 162: 409–427. Ripl, W. 1995. Ecological Modelling, 78: 61–76. Sir, M., Lichner, L., Tesar, M., Syrovatka, O. 2004. XXIInd Conference of the Danubian Countries of the Hydrological Forecasting and Hydrological Bases of Water Management, 30 August – 2 September 2004, Brno, Czech Republic, Conference Abstracts and CD. Tributsch, H., Cermak, J., Nadezhdina, N. 2005. J. Phys. Chem. B109: 17693–1707.


