An annotated sheet for every indicator
advertisement
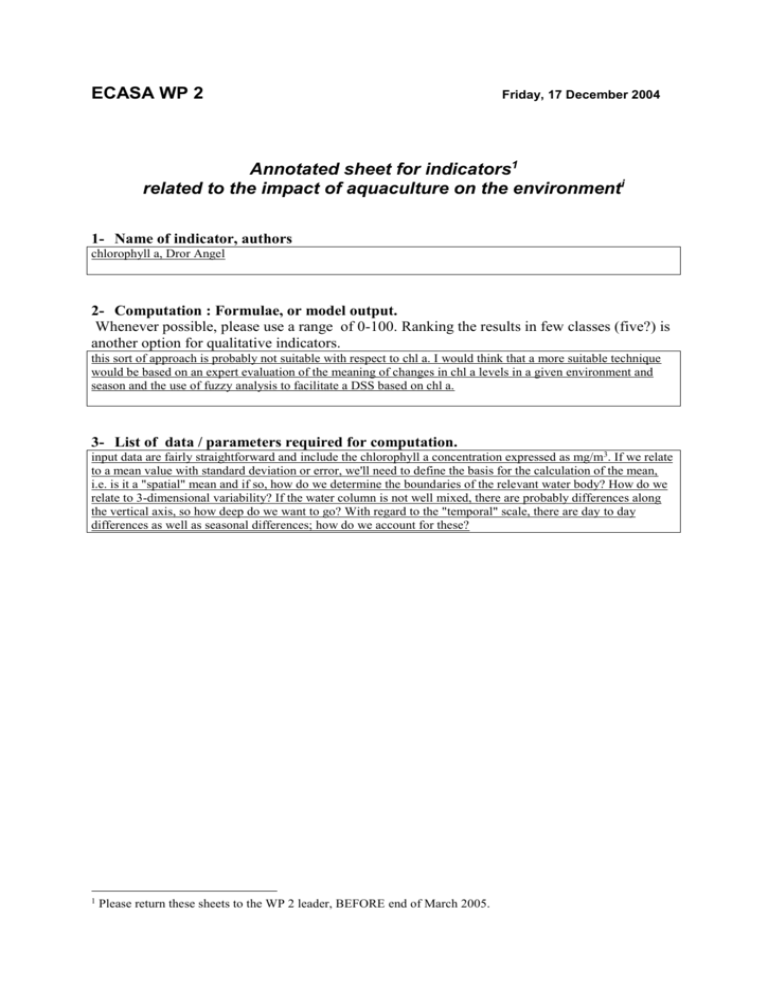
ECASA WP 2 Friday, 17 December 2004 Annotated sheet for indicators1 related to the impact of aquaculture on the environmenti 1- Name of indicator, authors chlorophyll a, Dror Angel 2- Computation : Formulae, or model output. Whenever possible, please use a range of 0-100. Ranking the results in few classes (five?) is another option for qualitative indicators. this sort of approach is probably not suitable with respect to chl a. I would think that a more suitable technique would be based on an expert evaluation of the meaning of changes in chl a levels in a given environment and season and the use of fuzzy analysis to facilitate a DSS based on chl a. 3- List of data / parameters required for computation. input data are fairly straightforward and include the chlorophyll a concentration expressed as mg/m3. If we relate to a mean value with standard deviation or error, we'll need to define the basis for the calculation of the mean, i.e. is it a "spatial" mean and if so, how do we determine the boundaries of the relevant water body? How do we relate to 3-dimensional variability? If the water column is not well mixed, there are probably differences along the vertical axis, so how deep do we want to go? With regard to the "temporal" scale, there are day to day differences as well as seasonal differences; how do we account for these? 1 Please return these sheets to the WP 2 leader, BEFORE end of March 2005. 4- Description of scientific meaning, references The "scientific meaning" of chl a concentration seems fairly simple since there is usually a fairly direct (linear?) relationship between the abundance of phytoplankton and the concentration of chlorophyll a that can be extracted from seston concentrated on glass fiber filters. Environmental "over-loading" of nutrients, as may potentially occur if fish farms are not properly sited and managed, often leads to "eutrophication" and one of the early signs of eutrophication is an increase in chl a levels. Many models describing eutrophication and eutrophication indicators utilize chl a concentration (e.g. Carlson 1977, Giovanardi and Tromellini 1992, Vollenweider et al. 1998). Complications involved in the use of chl a as an indicator are related to the fact that variations in chl a level occur "naturally" in response to the many factors that determine the composition and size of algal communities (PAR light levels, inorganic nutrients and nutrient ratios, toxins, grazers, parasites). Moreover, in many coastal environments, fairly high natural background levels of chl a make it very difficult to detect small changes in chl a. With respect to shellfish aquaculture, chl a may also serve as a meaningful indicator and the "beneficial" aspects of shellfish aquaculture include reduction in ambient chl a levels. References: Carlson, R. E. 1977, A trophic state index for lakes. Limnol. Oceanogr. 22, 361-369. Giovanardi, F. and Tromellini, E. 1992, Statistical assessment of trophic conditions. Application of the O.E.C.D. methodology to the marine environment, in Marine Coastal Eutrophication, (eds R. A. Vollenweider, R. Marchetti and R. Viviani). J. Science of the Total Environment, Elsevier, Amsterdam, Suppl. 1992, 211-234. Vollenweider, R.A., F. Giovanardi, G. Montanari, and A. Rinaldi. 1998, Characterization of the trophic conditions of marine coastal waters with special reference to the NW Adriatic Sea: proposal for a Trophic Scale, Turbidity and generalized Water Quality Index. Environmetrics 9 329–357. 5- Range of validity; please provide a description of the field of validity for the indicator, its limits, endpoints. Careful explanations should be given in a table about the correspondence between the computed values and the impact (from positive effect, no impact , moderate impact, high impact, unacceptable impact). (b as ed o n Vo ll e n we id er & Ker e ke s 1 9 8 2 ) No i mp act Ver y lo w i mp a ct ( h yp er - o li go t r o p hic) Lo w i mp ac t ( o li go tr o p h ic) Mo d er a te ( me s o tr o p h ic) Hi g h i mp ac t ( e utr o p h ic) U nacc ep t ab le i mp act ( h yp er - tr o p h ic) 6 -Type of aquaculture on which this indicator applies ALL of the following -Open sea aquaculture -Cage aquaculture -Longlines -Intertidal, extensive aquaculture -Earthen pond aquaculture located on the shoreline 6- Relevant environments for this indicator ch l a ( mg / m 3 ) 0 < 0 .7 0 .7 - 2 .1 2 .1 - 6 .2 5 6 .2 5 - 1 9 .2 > 1 9 .2 All Open sea Sheltered areas (bays, fjord, estuaries) Land-based marine aquaculture at the immediate vicinity of the shoreline 8- Quotation. We will need to select the most appropriate indicators to be proposed for EIA and site selection. Please suggest a quotation for this indicator for the following criteria (from A, perfectly adequate, to E, not relevant), to help evaluating the indicator within WP 4. Additional comments are welcome. Direct relevance to objectives : The indicator selection must be closely linked to the requirements of the EU: Use for environmental impact assessment and site selection. This aspect should be detailed. - A Clarity in design : It is important that the selected indicators are defined clearly in order to avoid confusion in their development or interpretation. - A Realistic collection or development costs : Indicators must be practical and realistic, and their cost of collection and development therefore need to be considered. This may lead to trade-offs between the information content of various indicators and the cost of collecting them. - B High quality and reliability : Indicators, and the information they provide, are only as good as the data from which they are derived. - A Appropriate spatial and temporal scale : Careful thought should be given to the appropriate spatial and temporal scale of indicators. - B Obvious significance : The meaning and usefulness of the indicator should easily be understood by stakeholders. They would preferably use the levels of dissolved oxygen, rather of sulphide concentrations. - A 9- Data and models related to this indicator, available for use by WP 4. Please list the data and models output available at local, national or regional scales for use by ECASA. They may not correspond to the more theoretical list asked for in §3. TRIX, TRBIX, GWQI (Vollenweider et al. 1998) 10- Suggestions for use by WP 5. Give examples of indicators/aquaculture/environments which can be field-tested during the course of WP 5. Some comments related to chl a as an indicator a) In order to simplify collection of chlorophyll data, it has become common to employ "in situ" fluorometers (ISF), which can generate detailed chl a vertical profiles at considerably less effort (compared to the extractive method) as workers have found a nice correlation between in situ fluorescence values and extracted chl a concentrations. However, the reliability of ISF data may be affected by such factors as solar quenching of algal pigments. There are ways to correct for quenching artifacts, but these may make the method cumbersome and impractical for rapid assessments by lay personnel. b) It may be desirable or necessary to combine chl a data with other water column variables to establish a more robust multi-variable indicator This document is intended to be used for internal work on ECASA workpackage. The final indicator sheet may include a format somewhat different. Please suggest any improvement for both the cojntent and the form of this document. i


