STUDENT`S SHEET Name: Date: ______ Activity 5.1: Hurricane
advertisement
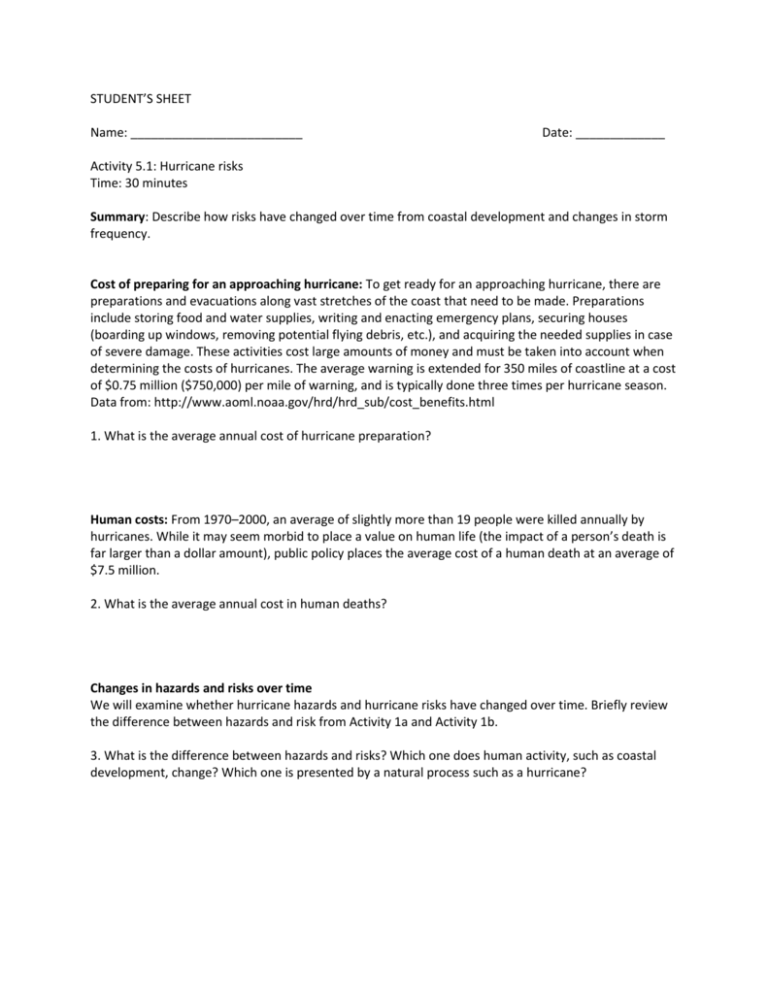
STUDENT’S SHEET Name: _________________________ Date: _____________ Activity 5.1: Hurricane risks Time: 30 minutes Summary: Describe how risks have changed over time from coastal development and changes in storm frequency. Cost of preparing for an approaching hurricane: To get ready for an approaching hurricane, there are preparations and evacuations along vast stretches of the coast that need to be made. Preparations include storing food and water supplies, writing and enacting emergency plans, securing houses (boarding up windows, removing potential flying debris, etc.), and acquiring the needed supplies in case of severe damage. These activities cost large amounts of money and must be taken into account when determining the costs of hurricanes. The average warning is extended for 350 miles of coastline at a cost of $0.75 million ($750,000) per mile of warning, and is typically done three times per hurricane season. Data from: http://www.aoml.noaa.gov/hrd/hrd_sub/cost_benefits.html 1. What is the average annual cost of hurricane preparation? Human costs: From 1970–2000, an average of slightly more than 19 people were killed annually by hurricanes. While it may seem morbid to place a value on human life (the impact of a person’s death is far larger than a dollar amount), public policy places the average cost of a human death at an average of $7.5 million. 2. What is the average annual cost in human deaths? Changes in hazards and risks over time We will examine whether hurricane hazards and hurricane risks have changed over time. Briefly review the difference between hazards and risk from Activity 1a and Activity 1b. 3. What is the difference between hazards and risks? Which one does human activity, such as coastal development, change? Which one is presented by a natural process such as a hurricane? To see if there have been significant changes in hurricane risks and hazards over time, plot the number of major storms, deaths, and costs per decade. 3. Plot the following data per decade on 1) the total number of hurricanes to strike the mainland United States, 2) the deaths, and 3) the cost of hurricanes per decade adjusted for inflation to 2010 dollars (Data from Blake and Gibney, 2011). Total Adjusted cost Decade hurricanes Deaths (2010 dollars) 1901-1910 18 764 691 1911-1920 20 1,008 4,705 1921-1930 15 2,925 2,913 1931-1940 19 1,197 8,181 1941-1950 24 184 7,619 1951-1960 18 952 20,761 1961-1970 14 531 36,038 1971-1980 12 226 25,904 1981-1990 15 140 27,842 1991-2000 14 242 82,130 2001-2010 19 1,431 249,164 Table 1. Decadal data on the total number of hurricanes, deaths, and costs (adjusted for inflation to 2010 dollars) for hurricanes that have struck the lower 48 United States. 4. Plot the number of hurricanes per decade that have hit the lower 48 states, 1901–2010, from Table 1 (Data from Blake and Gibney, 2011). 5. Plot the number of deaths per decade that have occurred in the lower 48 states, 1901–2010, from Table 1 (Data from Blake and Gibney, 2011). 6. Plot the cost of hurricane damage (adjusted to 2010 dollars) per decade that have hit the lower 48 states, 1901–2010, from Table 1 (Data from Blake and Gibney, 2011). 7. What are the patterns (trends) in the total number of hurricanes, deaths, and costs over time? 8. Have the preparations and evacuations been more effective in saving lives or reducing the damages (costs) of hurricanes? OPTIONAL ESSAY 9. Write a brief (1-2 paragraph) explanation for differences in the trends of number of hurricanes, deaths, and property damage (#8). What actions can be taken to decrease human deaths from a hurricane, and what can be done to reduce property damage? Include both short-term (such as actions taken when a hurricane is days away) and long-term (planning for years or decades into the future) actions in your answer.

