cad-based simulation and imaging tools for ut expertise

MODELING OF THE ULTRASONIC PROPAGATION
INTO CARBON-FIBER-REINFORCED EPOXY COMPOSITES,
USING A RAY THEORY BASED HOMOGENIZATION METHOD
S. Deydier 1 , N. Leymarie 1 , P. Calmon 1 , V. Mengeling 2
1 Commissariat à l’énergie Atomique, LIST, CEA-Saclay, bât. 611, 91191 Gif-sur-Yvette cedex, France
2 EADS/CCR, BP 76, 12 rue Pasteur, 92152 Suresnes cedex, France
ABSTRACT.
This paper describes a study dedicated to the modeling of the ultrasonic propagation in parts made of carbon-fiber-reinforced epoxy composites (CFRP), which is of great interest for the aircraft industry. In a previous article, we proposed to evaluate the field radiated into such components by means of a homogenization method coupled to the pencil model implemented in CIVA software.
This homogenization is based on the follow-up of the energy ray paths inside each ply of a pattern, and leads to effective stiffness constants through the building of a slowness surface. An improvement is proposed here which allows to take into account the inner refraction energy losses.
KEYWORDS: Composite, Homogenization, UT simulation, Ray Theory
PACS: 43.20.Dk; 43.35.Cg; 43.35.Mr; 43.35.Zc
INTRODUCTION
Simulation of ultrasonic testing is of great interest for the aircraft industry, as it gives powerful tools for improving measurements analysis and optimizing testing configurations.
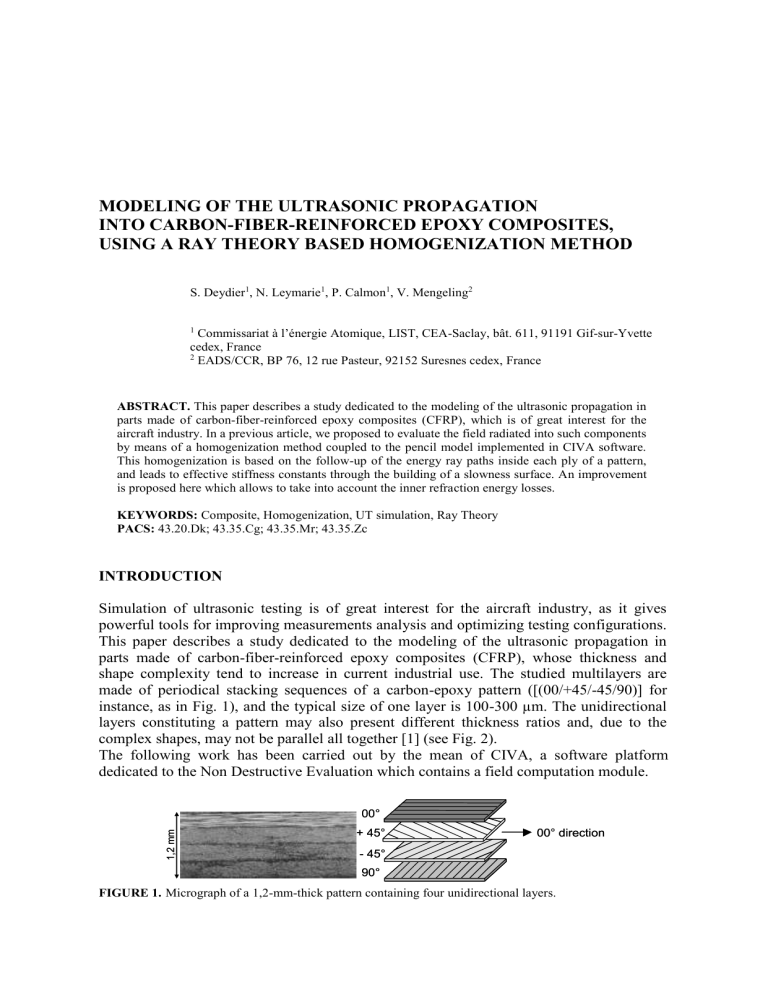
This paper describes a study dedicated to the modeling of the ultrasonic propagation in parts made of carbon-fiber-reinforced epoxy composites (CFRP), whose thickness and shape complexity tend to increase in current industrial use. The studied multilayers are made of periodical stacking sequences of a carbon-epoxy pattern ([(00/+45/-45/90)] for instance, as in Fig. 1), and the typical size of one layer is 100-300 µm. The unidirectional layers constituting a pattern may also present different thickness ratios and, due to the complex shapes, may not be parallel all together [1] (see Fig. 2).
The following work has been carried out by the mean of CIVA, a software platform dedicated to the Non Destructive Evaluation which contains a field computation module.
FIGURE 1.
Micrograph of a 1,2-mm-thick pattern containing four unidirectional layers.
FIGURE 2.
(a) Carbon-epoxy piece with parallel and non-parallel layers (slope: 8°). (b) Schematic view of the layers. (c) Same component after homogenization: parallel parts are simplified with one homogeneous material whereas non-parallel ones are replaced by the same homogeneous materials whose symmetry axis is progressively rotated (0°, 2°, 4° and 6°).
This module is based upon the pencil method and dedicated to the computation of transmitted ultrasonic beams transmitted by transducers into anisotropic or/and heterogeneous materials [2]. The approach proposed here consists in coupling the field computation model with a homogenization method. Homogenization gives a simpler description of the studied component, replacing layered structures into one homogeneous anisotropic effective medium for parallel layers, and into a heterogeneous medium made of several volumes otherwise (see Fig. 2 (c)).
This work follows a previous study [1], [3] which introduced the Ray theory Based
Homogenization method (RBH). The analysis of the experimental and simulated results proved the interest of this approach for our testing configurations. However, one step of the homogenization procedure remained to be done as the inner refractions were not taken into account. This phenomenon led to overestimated simulated displacement amplitudes when comparing with acquired data at non-null incident angles.
In the first part of this paper, we recall the different steps of the Ray theory Based
Homogenization, including the improvement of the method which consists in a simultaneous computation of an Effective Transmission Factor (ETF). A method evaluation is then presented with simulated data: the improvement as well as the benefits of the whole method are discussed through computed fields comparisons. In the third part, comparisons with experiments are presented.
RAY THEORY BASED HOMOGENIZATION
Introduction
The Ray theory Based Homogenization method (RBH) aims at obtaining the effective stiffness constants of anisotropic multilayers. This procedure is achieved considering the periodicity of the composites as described previously, i.e. only one pattern (period) of the component needs to be considered.
FIGURE 3.
Ray theory Based Homogenization: the follow-up of the energy path in one pattern (left) leads to an average energy direction AB=D e supposed to be that in the homogenized equivalent material (right).
The RBH method is carried out by following the energy ray paths inside each ply of the pattern under consideration, which gives access to average energy directions (as shown in Fig. 3). A simultaneous computation of an associated Effective Transmission Factor
(EFT) allows us to take into account the inner refraction phenomena. Then, the relationship between phase and energy directions leads to the geometrical construction of an overall slowness surface describing an anisotropic homogeneous medium, characterizing the whole composite. An optimization method is finally applied to obtain the associated effective stiffness tensor, which is then used in the simulations. These steps are described below.
Average Energy Directions
Let us consider an incident plane wave, represented by its slowness components along x- and y-axes (parallel to the interfaces), say S x
and S y
. The energy ray path is entering inside the studied pattern at point A and propagates toward an exit point B , defined in Fig. 3. The vector AB is supposed to be an average energy ray direction homogenized material and is written as:
D e
=AB in the
AB
Ac cd
de eB
M m
1
V e t m (m)
M d m e
V
(m)z e
V D
(m)
e
, (1) where c, d, and e are intersection points of the ray with the internal surfaces. The amounts
M , t m
, d m
and V e
(m)
are respectively the number of layers inside a pattern, the energy propagation time, thickness and energy speed vector in the m th
layer. As S x
and S y
are retained inside every layers (Descartes’ law), the only unknown is the z-slowness S z
when resolving the Christoffel’s equation [5]:
C
( m ) ijkl
S
( m ) j
S
( l m ) ik
G m ik
0
, (2) where the C
( m ijkl
)
are the m th
layer stiffness constants,
the density of the component and G m ik the Christoffel’s matrix. Inside each layer, equation (2) leads to a 6 th order polynomial, with six z-slowness solutions among which three are suitable (i.e. with down going energy). The polarization vector u m and the energy velocity vector are:
G m ik u m k
0 then V e
(m) i
C
( m ijkl
) u m j
u l m
S m k
(3)
This process is applied for a range of incident angles, in order to cover the transducer’s aperture: D e is in fact D e (S x
, S y
).
Effective Transmission Factor (ETF)
A recent improvement consists in adding to the method the computation of an
Effective Transmission Factor (ETF). This ETF aims at taking into account the successive energy losses, due to the refraction phenomena into the multi-layered materials. For a given incident plane wave, the ETF therefore writes (see Fig. 4):
ETF(S x
, S y
)
T(S x
, S y
)
N pattern
, with: (4)
T(S x
, S y
) pattern
T
12
T
23
T
34
T
41
(S x
, S y
) , (5) where N appears to be the number of patterns through which the ray propagates before it reaches the computation zone; Sx and Sy are the slowness coordinates. A range of
Tranmission factor will be applied to the pencils during the field computation, in order to cover the transducer’s aperture.
( ( S , , ) )
FIGURE 4.
Ray theory Based Homogenization: simultaneous computation of an Effective Transmission
Factor along the propagation path, as (T
12
T
23
T
34
T
41
) to the power of N. S x
and S y
define the incident plane waves orientations.
Effective Slowness Surface and Effective Stiffness Constants
Layers are constituted of the same CFRP material, disorientated around the z-axis.
Hence, at normal incidence, (S x
,S y
) = (0,0) and the z-slowness has the same value whatever the layer is, easily calculable using Christoffel’s equation. Thus, the very first point of the slowness surface P
(0)
is exactly known. As we know the abscissas of the following points and using the fact that the D e
directions are always normal to the slowness surface, we are able to build a 3D slowness surface, in an iterative way.
A fast optimization procedure is then used in order to find the effective stiffness constants leading to the best fit of slowness surfaces. Assuming that the homogenized medium symmetry is known (usually orthotropic), a function derived from the Christoffel equation
(2) is minimized, following [6].
EVALUATION OF THE METHOD ON SIMULATED DATA
RBH Homogenization of [(00/90/+45/-45)] Carbon-Epoxy
Let us consider the example of a [(00/90/+45/-45)]
5
carbon-epoxy composite whose pattern shows equal thicknesses. Both RBH procedure and the more classical Postma’s method have been applied to this material (stiffness constants on Fig. 6(a)). Postma’s homogenization method was the subject of a previous work [3] and is based on low frequency approximation, assuming static deformations. The set of RBH stiffness constants describing this material is computed by means of the optimization procedure described above assuming orthotropic symmetry. z i i i
1 z
P (0)
P (i-1)
T e
S z i i i
(unknown )
D e(i
N
)
P (i)
S i x
1
, , , S i y
1
i x
, , , S i y
e
FIGURE 5.
Ray theory Based Homogenization: iterative building of a synthesized slowness surface, using the relationship between phase and energy directions.
( 10
3
( 10
3
( (
Postma
) )
( 10
3
( (
RBH
) )
Ph Ph
( 10
3
( 10
3
FIGURE 6.
(a) RBH and Postma effective stiffness constants .Example of QP slowness surfaces: comparison between Postma Homogenization (light grey) and RBH (dark grey). 2-D (b) and 3-D (c) slownesses show the energy divergence between the two methods, in the same phase direction.
The resulting QP slowness curve is shown on Fig. 6(b) and (c) and compared with the
QP Postma slowness curve. It can be seen that RBH predicts a greater sensitivity to phase direction angle than Postma’s method, and a greater deviation between phase and energy directions appears at large incidences. The influence of these differences on the computed fields in realistic testing configurations is studied in the next section.
Comparison Between RBH Homogenized and Heterogeneous Material, by Simulation of Transmitted Beams
The performances of the RBH method have been evaluated by comparing fields radiated by a given transducer and transmitted through homogenized (Postma’s and RBH) and non-homogenized structures (by considering every layer in the calculation). The analysis has been performed on QP fields computed in CIVA in the case of a structure constituted by 20 layers of [(00/90/+45/-45)] CRFP, the proportions of each orientation being respectively 50%, 10%, 20% and 20%. In the case of non-homogenized material, only the first arrival contributions are taken into account (the contributions of inner multiple reflections are negligible).
Simulations of fields transmitted in a planar part by immersion transducers of varying frequency and under different incident angles (see Fig. 7, 0° left and 4° right) have been performed. On Fig. 7 are reported the transmitted displacement maxima u z
versus frequency
( u z
being the component normal to the surface) through the 20 layers, homogenized or not.
It can be seen that RBH predictions are much closer to the results computed by taking into account the multi-layered structure than Postma’s. The discrepancies observed when applying Postma’s method also increase with frequency and incident angle.
( ( al ways MAX: reference ) )
FIGURE 7.
Z-displacement fields maxima computed by Champ-Sons. Amplitudes evolution with the transducer frequency (MHz) when the QP incident angle is null (left) or 4° (right).
EXPERIMENTAL VALIDATION
A set of experiments have been performed in order to validate the approach on a realistic situation involving both complex geometry and non-parallel plies. The inspected part is shown on Fig. 2: its incoming surface presents two horizontal areas, separated by a tapered region in which the number of layers increases progressively. An immersion transducer (diameter 12.7 mm, frequency 5MHz) is used at vertical incidence. Four different positions I, II, III and IV have been defined (see Fig. 8 (a)) for the transducer in order to cover the different situations occurring during the scanning of this part. Positions I and IV, on the horizontal parts, correspond to normal incidence (horizontal surface) whereas positions II and III, over the slope, correspond to an 8° incident angle. For each position, the field transmitted through the piece is measured by scanning a receiver positioned at the back wall surface.
The received signal evolution can be directly compared to calculations of the vertical component of the displacement field, as the attenuation is computed by a previously described model [4]. Fig. 8 (b) shows the transmitted fields measured in the four configurations, which are compared to the computed fields using homogenized media with
RBH method in Fig. 8 (c). These simulations have been performed by considering that the material under the slope can be defined by several areas constituted of the same homogenized anisotropic material but with disoriented axes, as in Fig. 2. The horizontal deflection of the beam, say
X
MAX
(i.e. the distance between the axis of the transducer and the center of the outgoing beam) is correctly predicted in positions II and III, and is of course null in positions I and IV.
The amplitude distribution of the field transmitted at the backwall surface has also been investigated. Fig. 9 shows a comparison between measurements and RBH predictions of the amplitude vs. probe position for the four transmitter positions. In order to superimpose the four curves, they have been plotted versus
x which is the horizontal distance between transmitter and receiver positions. Since one aims here at comparing the relative evolution of the maximum amplitudes, the two set of curves have been independently normalized with respect to the maximum of the curve at position I.
FIGURE 8.
(a) Definition of the four positions of the transducer. (b) Transmitted fields (vertical particle displacements) measured for the different positions, beam width and height in mm being indicated. (c)
Simulated fields using RBH.
I I I
II
III
IV
x
x
FIGURE 9.
Transmitted fields along x-axis ((a) experiment, (b) RBH approach). The four positions of the transducer are superimposed, in a coordinate system relative to the transmitter. The beam deviations are also recalled.
It can be seen that the agreement is quite good: the computations in homogenized structure correctly predict the different amplitude distributions in the beams and the relative amplitudes levels.
CONCLUSION
A homogenization method of Carbon-Fiber-Reinforced composites specifically developed for ultrasonic NDT applications is presented here. This method, based on ray theory, leads to effective stiffness constants and allows to apply simulation tools developed for homogeneous materials. The performances of this RBH method have been evaluated both theoretically and experimentally. It has been shown that coupled to a field computation model, it correctly predicts transmitted beams through a non planar multilayered structure.
REFERENCES
1.
Deydier, S., Gengembre, N., Calmon, P., Petillon, O. and Mengeling, V., in Review of Progress in QNDE , Vol. 24 B, eds D. O. Thompson and D. E. Chimenti, AIP
Conference Proceedings, Melville, 2004, p. 1051.
2.
Gengembre N. and Lhémery A., Review of Progress in QNDE , Vol. 19, op. cit.
(2000), p. 977.
3.
Gengembre, N., Calmon, P., Petillon, O. and Chatillon, S., in Review of Progress in QNDE , Vol. 22, eds D. O. Thompson and D. E. Chimenti, AIP Conference
Proceedings, Melville, 2003, p. 957.
4.
Lonné, S., Lhémery, A., Calmon, P., Biwa, S. and Thévenot, F.,
Review of
Progress in QNDE , Vol. 23, op. cit.
(2004), p. 875.
5.
Royer, D. and Dieulesaint, E., Ondes élastiques dans les solides , Tome 1, Masson,
1996.
6.
Aristégui, C. and Baste, S.,
J. Acoust. Soc. Am ., 102 , 1503 (1997).


