Auxiliary Material
advertisement
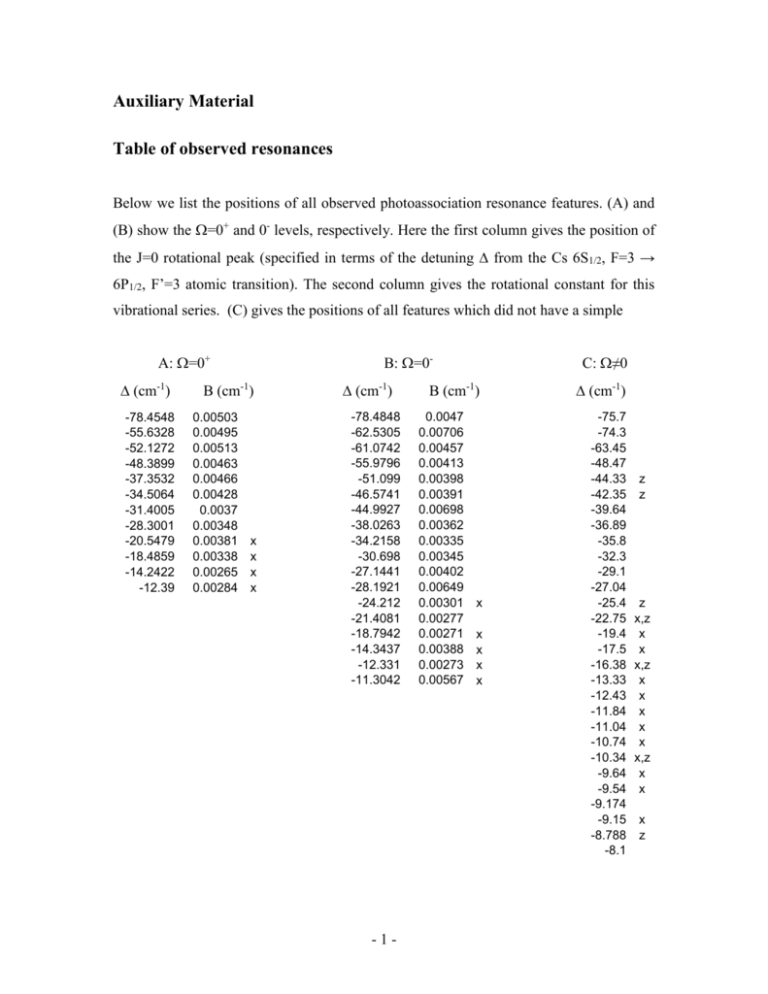
Auxiliary Material Table of observed resonances Below we list the positions of all observed photoassociation resonance features. (A) and (B) show the =0+ and 0- levels, respectively. Here the first column gives the position of the J=0 rotational peak (specified in terms of the detuning from the Cs 6S1/2, F=3 → 6P1/2, F’=3 atomic transition). The second column gives the rotational constant for this vibrational series. (C) gives the positions of all features which did not have a simple A:=0+ (cm-1) -78.4548 -55.6328 -52.1272 -48.3899 -37.3532 -34.5064 -31.4005 -28.3001 -20.5479 -18.4859 -14.2422 -12.39 B:=0- B (cm-1) 0.00503 0.00495 0.00513 0.00463 0.00466 0.00428 0.0037 0.00348 0.00381 0.00338 0.00265 0.00284 x x x x (cm-1) -78.4848 -62.5305 -61.0742 -55.9796 -51.099 -46.5741 -44.9927 -38.0263 -34.2158 -30.698 -27.1441 -28.1921 -24.212 -21.4081 -18.7942 -14.3437 -12.331 -11.3042 -1- C:≠0 B (cm-1) 0.0047 0.00706 0.00457 0.00413 0.00398 0.00391 0.00698 0.00362 0.00335 0.00345 0.00402 0.00649 0.00301 0.00277 0.00271 0.00388 0.00273 0.00567 x x x x x (cm-1) -75.7 -74.3 -63.45 -48.47 -44.33 z -42.35 z -39.64 -36.89 -35.8 -32.3 -29.1 -27.04 -25.4 z -22.75 x,z -19.4 x -17.5 x -16.38 x,z -13.33 x -12.43 x -11.84 x -11.04 x -10.74 x -10.34 x,z -9.64 x -9.54 x -9.174 -9.15 x -8.788 z -8.1 rotational structure, and therefore could not be clearly identified as having =0±. Here, we give simply the center of mass of the observed peak structure, which typically extended over ~0.1 cm-1 (i.e. Fig. 2(b)). The final column in all three tables is used to indicate the absolute accuracy of the measured resonance position; the resonances marked with an “x” were observed using a wavemeter with a lower absolute accuracy of ~0.05 cm-1, while those not marked are accurate to ~0.005 cm-1. Some of the ≠0 complexes were overlapped with predicted =0 levels; these are denoted with “z”. Experimental methods and apparatus We detect the formation of RbCs* molecules using the trap-loss method.1,2 As described in the main text, the photoassociation-induced loss rate of atoms causes a reduction in the steady-state trap fluorescence, which we observe. The trap populations are governed by the following rate equations (where the index a,b=Rb,Cs): N a Ra N a 1 PA MOT 2 1 MOT K a ,a na K a ,b na nb dV K a ,b ( I PA ) na nb dV 2 2 MOT PA beam (1) Here Ri are the loading rates from the background vapor, Ki,iMOT (Ki,jMOT) are the intra(inter-)species two-body loss rates intrinsic to the trap, and Ki,jPA is the inter-species twobody loss rate associated with the photoassociation light; the latter constitutes the signal we wish to observe. Note that the factor of ½ in front of the terms involving both Rb and Cs densities accounts for the fact that one atom of each species is lost in each event. From Eq. (1), it is clear that to produce the maximum fractional effect on the steady-state trap populations due to heteronuclear photoassociation, one wants to maximize the size of the photoassociation-induced loss, and simultaneously minimize all other losses in the trap. This was accomplished in our experiments in large part by the use of forced dark-spot MOTs3,4,5 for both trapped species. The dark spot was implemented in the standard way using the shadow of a 3mm diameter opaque disk placed in the two crossed repumping beams to create a “dark” region around the trapped atoms. Both the Rb and Cs traps also -2- required the use of a forced “depumping” beam to make the spot sufficiently dark for optimal atomic density5. These beams, on the F=4 → F’=4 transition for Cs and the F=3 → F’=2 transition for Rb, were created from the trapping light using additional AOMs; they each had an e-2 half width of ~1.3 mm, and intensities of 2.0 mW/cm2 and 0.8 mW/cm2, respectively. We further reduced the intrinsic losses (primarily due to two-body light-assisted collisions) in our Rb trap by decreasing the intensity of the trapping light to 3.8 mW/cm2 per beam. The same procedure was not used in the Cs trap, which had an intensity of 12 mW/cm2 per beam; here, the losses had to be kept relatively high to prevent large depletion of its population on the many strong Cs2 photoassociation resonances, which would tend to obscure RbCs features occurring nearby. The trapping beams for the two MOTs were individually coupled into two separate single-mode polarization-maintaining fibers for mode filtering and long-term mechanical stability. These two wavelengths were directed into the vacuum chamber using two separate sets of optics, allowing independent adjustment of the two traps. This proved essential for reliable, simultaneous optimization of both the spatial overlap between the two MOTs and their individual atomic densities. The detunings used were -12.5 MHz for Cs and 13.8 MHz for Rb; the magnetic field gradient was ~5 G/cm. Due to the short-range character of the RbCs* levels we excite, relatively high PA laser intensities were necessary to compensate for the smaller free-bound Franck-Condon factors. We extend the range of accessible intensities by coupling the output of the photoassociation laser into a build-up cavity placed around the vacuum chamber. This 25 cm long semi-confocal resonator consisted of a flat, high-reflecting rear mirror, and a curved input coupler with a reflectivity of 97%. The input beam was modematched into the TEM00 mode of the cavity, whose e-2 mode waist at the position of the atomic clouds was ~380 m. The cavity length was actively stabilized relative to the PA laser wavelength using the Hänsch-Couillaud method6. A fused silica Brewster plate ARcoated on one side was placed inside the cavity, and the incident linear polarization of the photoassociation laser was rotated slightly away from the Brewster axis. A glass pickoff plate was inserted into the beam in front of the cavity at near-normal incidence to measure the polarization of the reflected light, and the resulting error signal was used to -3- feed back to a piezoelectric stack controlling the position of the rear mirror. To allow the cavity lock to robustly track the frequency of the photoassociation laser as it was scanned, an automatic re-locking feature was implemented. The intracavity intensity was actively monitored with a photodiode via one of the reflections off the Brewster plate; if this intensity fell below a preset level, a simple circuit shorted the voltage on the servo lock’s integrator for about ~1 ms, resetting it, and allowing the cavity to re-lock itself. The maximum finesse obtained with this cavity was ~60, limited in roughly equal amounts by the Brewster plate and the chamber windows. Due to the non-optimal input coupling of the cavity, this resulted in a maximum power buildup of about a factor of 15, and a resulting peak intensity at the position of the atoms up to ~4 x 10⁷ W/m2. In order to detect the trap loss induced by photoassociation, the fluorescence rate of each MOT was continuously observed, as a relative measurement of the number of trapped atoms. Note that although the MOTs were “dark” they still emitted sufficient fluorescence to be easily detected. To reduce spurious electronic noise, a lock-in detection method was used, where both trap laser frequencies were modulated with a depth of a few MHz, at two different frequencies near 4 kHz. The fluorescence was collected by imaging the MOTs onto a photodiode, whose output was fed in parallel into two separate lock-in amplifiers. The two demodulated output signals were separately recorded for each frequency value of the photoassociation laser, which was scanned in discrete frequency steps. After each step, the MOT was emptied by turning off the repumper, and then reloaded again for each new PA laser frequency. This avoided any coupling between adjacent points, and allowed us to monitor the loading time for each point, and for each species. The measured frequency of the photoassociation laser was also recorded for each point. The photoassociation laser frequency was ordinarily monitored using a wavemeter having 150 MHz absolute accuracy, which was sufficient for most of our experiments. For the DC Stark effect measurements, we attained better accuracy of relative frequency measurements as follows: a small fraction of the photoassociation laser light was coupled into a Fabry-Perot optical spectrum analyzer (300 MHz free spectral range) along with -4- some light from the Rb trap laser. Since the latter was locked to < 1 MHz absolutely, the splitting between the two resulting peaks observed as the spectrum analyzer cavity was scanned provided a measurement of the photoassociation laser frequency which could be compared between scans, independent of thermal drifts of the spectrum analyzer cavity itself. This splitting was obtained in real time by digitizing the optical spectrum as observed on an oscilloscope for each photoassociation laser frequency. The resolution of this measurement was limited by the linewidth of the Fabry-Perot, about 5 MHz. The density, atom number, and temperature of the two atomic clouds, as well as their relative spatial overlap, were measured using two-color absorptive imaging from two orthogonal directions. The MOT beams were first extinguished, and then a 20 s “fill-in” pulse from an additional repumping beam directed into the dark region was used to optically pump all of the trapped atoms back into their upper (“bright”) hyperfine state (F=4 for Cs and F=3 for 85 Rb). Subsequently, the atoms were illuminated with a weak probe beam for 20 s, containing light detuned a controllable amount from either one of the two species’ trapping transitions. The two shadows cast by each MOT cloud were imaged separately onto two CCD cameras, and the magnification was calibrated using a test pattern at an equivalent image plane. Using the known detuning from atomic resonance, and the observed optical depth and spatial size of the clouds (typically e-2 half width of 750 m), the peak density and atom number were inferred, according to the relations: np 1 0 wl 2 I 2 ln 1 I 0 2 N wl wt2 n p 2 (2) 3/ 2 Here, wl, and wt are the observed e-2 half widths of the cloud along and perpendicular to the direction of an absorption beam, 0 is the average resonant cross-section, I/I0 is the minimum (fractional) transmitted intensity, is the detuning from atomic resonance, and is the atomic natural linewidth. Note that for 0 we assumed an unpolarized atomic -5- sample; we checked this assumption by verifying that there was no dependence of the optical depth on the polarization of the absorption probe beam. The total atom number for each trap was independently measured by switching the MOT lasers quickly to resonance, and collecting the resulting fluorescence into a known solid angle with a calibrated photodiode. Finally, the temperatures of the two clouds were measured with time-of-flight absorption imaging, in which a =12 ms period of free expansion was inserted in between the MOT shutoff and the absorption imaging sequence. A fit to the resulting gaussian-shaped image yielded the temperature in terms of the measured fullwidth at half maximum of the cloud w(), according to: k B T w( ) 2 w(0) 2 8 Mln 2 (3) 2 where the second term is a correction for the measured initial size. Saturation effects On several of the =0± resonances, we studied the dependence of the photoassociation loss as a function of PA laser intensity, and observed a clear saturation behavior, where the loss rate reached a peak value and then slowly decreased. This saturation is expected, where the peak value is simply the unitarity limit for any binary collision process. The unitarity-limited inelastic collision rate coefficient is given by7,8: max K PA 2 3/ 2 k 2 3 10 11 cm 3 s 1 , k BT (4) where we have included only s-wave (=0) collisions, and plugged in the average of the observed Rb and Cs temperatures. We are justified (approximately) in considering only photoassociation events resulting from s-wave collisions, since at MOT temperatures most atom pairs do not have enough energy to penetrate inside the > 0 angular -6- momentum barriers (which have heights of ~80 K and ~240 K for =1 and =2, respectively for Rb+Cs), where the excitation occurs. Note that the effect of flux enhancement9, which produced contributions from significantly higher partial waves in previous homonuclear photoassociation work10, should be strongly suppressed in our experiments due to the fact that the MOTs are dark, and because excitation by the MOT lasers occurs at much shorter range in a heteronuclear collision. This is confirmed by the fact that in our =0± observations the J > 2 peaks are strongly suppressed, consistent with a near total suppression of > 1 scattering. Expression (4) above then leads us to expect a maximum steady-state PA-induced loss rate in the unitarity limit of: Lmax 1 max K PA nRbnCs dV 2 108 s 1 2 PA beam (5) Here we have used our measured densities, cloud sizes, and PA beam size; we have also assumed a typical ~50% Rb trap loss, and neglected the Cs trap loss (Note that the instantaneous loss rate before the Rb trap is depleted would therefore be twice as high). The above value is in good agreement with the maximum loss rate we estimate from our observations for a typical saturated =0, J=1 resonance of ~ 1.5 x 10⁸ s-1. This estimate is based on the observed time-evolution of the Rb trap population with the PA laser tuned on and off resonance, using the analytic solution of eq. (1) above. Note that the saturated loss rate on the J=0 peaks is smaller than for J=1 (or J=2) (e.g. Fig. 2), since a smaller fraction of the colliding pairs can be excited to a J=0 rotational state. This is a result of the fact that J=0 can be only be excited in a p-wave collision, and also its smaller angular degeneracy. We have also verified that the intensities at which we observe these features to saturate are in qualitative agreement with a simple theoretical estimate. The resonant, intensitydependent loss rate coefficient can be written, in a perturbative model, as8: -7- max K PA K PA 4 / m (6) 1 / m 2 where m is the radiative linewidth of the excited molecular state, and characterizes the optical coupling: 2 2 2m F (7) Here, m is the molecular Rabi frequency characterizing the electronic matrix element between the free-atom pair and excited molecular state, and F is the Franck-Condon factor characterizing the matrix element of the interatomic (nuclear) motion. From eq. (6), we can see that a maximum in the photoassociation rate will occur for m, above which the rate will actually decrease, effectively due to power broadening of the excited molecular state. If we make the simple assumption that for the very weakly bound RbCs* states of interest here the quantities m and m can be approximated by the atomic values for Cs, we have: I SPA 1 IS Cs F (8) Where IS is the atomic saturation intensity, Cs is the atomic radiative linewidth, and ISPA is the intensity at which the photoassociation loss saturates. Note that the Franck-Condon factor F has units of (energy)-1 here, where energy-normalized continuum wavefunctions for the ground state have been assumed. The Franck-Condon factor can be written, in the reflection approximation7, for an R-6 potential, as11: (7 / 6) RC6 F 2 (2 / 3) C6* 1/ 2 ( RC ) 2 (9) -8- Here, (x) are Gamma functions, is the reduced mass for a Rb+Cs collision, C6* is the excited-state van der Waals coefficient, RC is the classical outer turning point of the resonant excited state, and (RC) is the ground-state wavefunction of the interatomic motion evaluated at this distance, the so-called Condon radius7. In order to approximate the ground state wavefunction (RC), we can use the simple WKB form: 2 ( RC ) 2 k ( R) 1/ 2 sin k ( RC ) RC (10) where k(R) is the WKB wavevector: 2 V g ( R ) k ( R ) 2 1/ 2 (11) and Vg(R) = C6R-6 is the asymptotic ground state interatomic potential. Here we have neglected the asymptotic kinetic energy, since at the Condon radii characteristic of the present work (9-18Å) the kinetic energy of the pair’s relative motion is much larger, due to the attractive ground state van der Waals potential (for example, at a distance of 18Å, the kinetic energy is equivalent to a temperature of 0.5 K). Note that in general quantum threshold behavior suppresses the true wavefunction at short range relative to the WKB amplitude shown above as the energy is decreased far below a characteristic threshold value EQ12. For the present case, however, EQ=150 K is comparable to our temperatures so that the WKB approximation is reasonable. Combining (8)-(11), and approximating the sinusoidal factor in eq. (10) above with its R-averaged rms value, we finally obtain: I SPA E 1.5 B IS Cs C6 * 2C6 1/ 2 (12) -9- Where EB is the binding energy of the resonant excited molecular state. This gives a value of ~106 W/cm2 for a RbCs* state bound by 50 cm-1, and ~107 W/cm2 for a state bound by 600 cm-1, which should roughly characterize the range of states accessed here (coupled mixtures of states dissociating to 6P1/2 and 6P3/2). These values are in good qualitative agreement with the range of observed intensities where the PA-induced loss saturated. Analysis and Predictions Analysis of our observed photoassociation spectra has so far focused on the Ω=0± states, which are clearly distinguishable by their simple rotational structure, as in Fig. 2(a). Model potentials obtained from a combination of previous experimental data and ab initio calculations were adjusted to incorporate the measured positions of these weakly bound levels. For the A1Σ+ and b3Π states, the model potentials are based on a previous fit to spectral data obtained via laser-induced fluorescence to the ground state and Fourier transform spectroscopy13,14. These were extended to smaller internuclear distance R by extrapolations of the form A + B/Rn (where A and B are obtained from the highest innermost RKR turning points), and to larger R using C6 and C8 dispersion terms and estimated exchange effects of the form: Vex (R) = C Re-R (where and are obtained from atomic ionization energies, and C is fitted to the data)15. As no experimental data is yet available for the (2)3Σ+ and (1)1Π states, ab initio non-relativistic potentials16 were used, and were extended to larger R with C6 and C8 dispersion terms. The C6 coefficients were allowed to vary in the fits, while the C8 coefficients were held fixed at the ab initio values of Marinescu and Sadeghpour17. Diagonal and off-diagonal spin-orbit functions whose asymptotic limit corresponds to the Cs 62P fine structure splitting, but with a substantial dip near R=5.5Å as discussed previously13, were incorporated into the Hamiltonian matrix18. Eigenvalues were computed by the discrete variable representation (DVR) approach19,20, using >2000 mesh points and 2, 5, or 6 channels for J=0, 1, >1, respectively. - 10 - The values for the long-range dispersion coefficient C6 extracted from the fits to our observations of weakly bound Ω=0± levels, shown in Fig. 4, are tabulated below: present work: ab initio theory17 0 2.7052(16) x 104 2.6721 0+ 8.256(5) 8.2377 0+ 7.90(1) 8.2377 3 1 3 The errors shown are purely statistical, and do not include any estimate of systematic uncertainties, which we discuss briefly below. Also shown are the ab initio values of Marinescu and Sadeghpour17, which are within 1% of ours for the 30 and 10+ states. These calculations do not include higher-order relativistic effects, and therefore predict identical values for 1Σ0+ and 3Σ0+. We found, however, that in fitting the observed 0levels better agreement could be obtained by allowing the 3Σ0+ state’s C6 value to vary independently, and our fitted result listed above differs by about 4% from the prediction. This discrepancy may in large part arise from our insufficient knowledge of the short range 3Σ0+ potential, for which we used an ab initio curve16; however, although we attempted to fit harmonic perturbations to this curve at short range, this did not significantly improve the discrepancy in the 3Σ0+ state’s C6. When the C6 values for the 1 Σ0+ and 3Σ0+ states were constrained in the fit to be the same, the total variance of the fit increased by ~20%, and the agreement for the fitted 30 value was worse, differing by ~3% from the prediction. We attempted to estimate the systematic uncertainty in our fitted values for the C6 coefficients by adjusting other fixed parameters in the potentials, and observing how the fitted values were affected. First, we tried fitting only the observed 0+ levels, to investigate whether the b30 and A10+ states’ fitted C6 values were spuriously coupled to errors in the ab initio (2)30+ potential through the global fits including our 0observations; this effect was comparable to the statistical error quoted above. We varied the fixed C8 values over the entire specified 5% uncertainty range of the calculations17; this produced 1.5% and 2.5% changes in the fitted C6 values for the 0+ and 0 states, - 11 - respectively. We also tried setting the assumed exchange term at intermediate range to zero; this had a negligible effect on the C6 values. Despite these tests, it is not entirely clear that modifications of the potentials, of a type we have not considered, could have a substantial systematic effect on the extracted C6 values. Thus, although values within a few percent of the theoretical values can reproduce our data well, we cannot definitively assign values and uncertainties to the parameters based on our data. Our analysis of Ω=1,2 levels is as yet incomplete because we have not yet analyzed their complicated hyperfine structure, and this will be the subject of a future publication. Note that hyperfine mixing is expected between these levels and those with Ω=0± when an accidental near-degeneracy occurs; the resulting localized perturbations in level energies may be an important limitation of the present fits which involve only Ω=0± levels. Based on these model potentials, we have calculated the Franck-Condon factors for decay from the observed Ω=0± levels to bound vibrational levels of the X1+ ground state. Note that since the 0- levels have no singlet component (they are a mixture of the (2)3+ and b3 states only) they do not decay to the X1+ ground state; therefore, we focus here on the observed levels identified as having Ω=0+, shown in Fig. 4. Fig. S1A shows the calculated Franck-Condon factors for decay as a function of ground-state vibrational level v, for three different Ω=0+ states at detunings -100.7 cm-1 (black), -56.13 cm-1 (red), and -22.17 cm-1 (blue). The horizontal axis also shows the corresponding ground state binding energies. The curves each consist of three distinct features. Each of these can be understood in terms of an approximate coincidence between excited and ground state vibrational turning points. The first, starting from the right of the figure, consists of levels bound by only ~10 cm-1, and results from direct decay at the outermost turning point of the resonant excited state, to ground states with nearly the same outer turning point. This peak moves noticeably towards larger binding energy as the detuning is increased and the corresponding outer turning point moves to shorter range. At binding energies near 100 cm-1, another peak is visible, associated with decay at the intermediate turning point of the potential dissociating asymptotically to Rb 5S1/2 + Cs 6P3/2, as shown in Fig. 1(b), to ground states with a nearby outer turning point. Due to coupling at an avoided crossing - 12 - between the A1+ and b3 states (which adiabatically correlate at long range to the two Ω=0+ states) induced by the spin-orbit interaction, these 0+ levels in general have a mixed character with both long and intermediate range outer turning points, as shown in the inset to Fig. 4(b). Note that decay via this type of intermediate outer turning point was observed in the coupled 0u+ states of Cs2*, and was used to produce large numbers of relatively weakly bound ground-state Cs2 molecules21. Finally, a third peak associated with levels bound by ~1300 cm-1 results from decay at the inner turning point of the A1+ potential to ground states with v~62 that have approximately the same inner turning point. Note that the second and third peaks just described do not move significantly with excited state binding energy, due to the steep slope of the relevant potentials. An interesting feature of Fig. S1A, detailed in the inset, is the “oscillatory” character of the peak Franck-Condon factor for the v~62 feature as a function of excited state binding energy. This results from the variation of the A1+ and b3 fractions of these states at short range; excited levels that have strong A1+ character at short range decay with relatively high probability to v~62 where the inner turning points of the A1+ and X1+ states coincide, while levels which are mostly b3 at short range cannot decay to the ground X1+ state at all. The oscillatory character of these relative fractions is another manifestation of the strong coupling between the two interleaved 0+ vibrational series dissociating to Cs 6P1/2 and 6P3/2. Note that this effect, and the resulting large FranckCondon factors for decay to the X1+ state on the peaks of the curve shown in the inset to Fig. S1A, is not dependent on the specific details of our RbCs* potentials; rather, it is due in a more general sense to their (asymptotic) short-range character, and the large coupling between 0+ vibrational states that results from it. We have carried out a similar calculation of the decay to the ground state from excited =1 levels, which arises purely from their (1)1 component. For these results, shown in Fig. S1B, we rely on an ab initio (1)1 potential16; they should therefore be interpreted with a degree of caution. However, it is only the qualitative features of the results that we - 13 - wish to point out, which are relatively robust with respect to modifications of the detailed (1)1 potential. With this caveat, we point out that the use of excited =1 levels for the production of ground-state molecules could be particularly promising, for two reasons. First, the (at least partially) resolved hyperfine structure (e.g. Fig. 2(b)) might make it possible to control the nuclear spin orientation of the resulting ground state molecules; this could be of some importance, since to leading order the nuclear spin is completely decoupled from all other degrees of freedom once the molecule is in the X1+ state. Second, the calculated Franck-Condon factors are even more favorable for producing deeply bound ground state molecules, as shown in Fig. S1B, for three detunings: -74.71 cm-1 (black), -69.85 cm-1 (red), and -64.84 cm-1 (blue). Evident in the figure are four distinct peaks, arising from similar considerations to those discussed above in connection with Fig. S1A. The peak near -3000 cm-1 corresponds to decay at the inner turning point of the (1)1 potential. Since this potential is much more localized in R than is the =0+ A1+ state, the Franck-Condon factors per ground state are much larger; moreover, since its inner turning point occurs at longer range (~4Å) it lines up with those of much more deeply bound ground levels (v~18) than in the =0+ case. A similar, though much more complicated, “oscillatory” behavior is also predicted in the probability for decay at the inner turning point to the ground state as a function of excited state binding energy, in this case due to a coupling between vibrational levels of the b3, (2)3+, and (1)1 states. For typical experimental parameters as discussed above, and for the levels shown in the figure with a strong mixture of this state, the predicted molecular formation rate for ground state levels near v~18 is 2 x 10⁶ s-1 per level. - 14 - Figure S1: Calculated Franck-Condon factors for decay to ground X1+ vibrational states. The horizontal axis gives the vibrational quantum number (v) and the corresponding binding energy; the vertical axis gives the calculated Franck-Condon factor for decay. - 15 - The product of this number and the photoassociation rate gives the formation rate of ground state molecules per vibrational level. The red, blue, and black curves in each figure correspond to three different excited levels for (A) the =0+ states, and (B) the =1 states. Remarks in the graphs give the relevant excited state vibrational turning point for each peak. The inset in A shows the oscillatory character of the peak Franck-Condon factor near v=62 as a function of excited state binding energy. This oscillation arises from the variation of the excited levels’ A1+ character with binding energy, arising from the coupling between the two =0+ states described in the text. 1 J. D. Miller, R. A. Cline, and D. J. Heinzen, Phys. Rev. Lett. 71, 2204-2207 (1993) 2 H. Wang, P. L. Gould, and W. C. Stwalley, Phys. Rev. A 53, R1216-R1219 (1996) 3 W. Ketterle, K. B. Davis, M. A. Joffe, A. Martin, and D. E. Pritchard, Phys. Rev. Lett. 70, 2253-2256 (1993) 4 M. H. Anderson, W. Petrich, J. R. Ensher, and E. A. Cornell, Phys. Rev. A 50, R3597- R3600 (1994) 5 C. G. Townsend, N. H. Edwards, K. P. Zetie, C. J. Cooper, J. Rink, and C. J. Foot, Phys. Rev. A 53, 1702 (1996) 6 T.W. Hänsch and B. Couillaud, Opt. Comm. 35, 441 (1980) 7 P.S. Julienne, J. Res. Natl. Inst. Stand. Technol. 101, 487 (1996) 8 J.L. Bohn and P.S. Julienne, Phys. Rev. A 60, 414 (1999) 9 V. Sanchez-Villicana, S. D. Gensemer, and P. L. Gould, Phys. Rev. A 54, R3730- R3733 (1996) 10 A. Fioretti, D. Comparat, C. Drag, T. F. Gallagher, and P. Pillet, Phys. Rev. Lett. 82, 1839-1842 (1999) 11 H. Wang and W.C. Stwalley, J. Chem. Phys. 108, 5767 (1998) 12 P.S. Julienne and F.H. Mies, J. Opt. Soc. Am. B 6, 2257 (1989) 13 T. Bergeman, C. E. Fellows, R. F. Gutterres, and C. Amiot, Phys. Rev. A 67, 050501 (2003) - 16 - 14 Additional data on the A1+ and b3 states has recently been obtained via fluorescence from higher-lying excited states, the analysis of which is underway: [C. Fellows, R. Gutterres, T. Bergeman and C. Amiot, unpublished] 15 M. Marinescu and A. Dalgarno, Z. Phys. D 36, 239 (1996) 16 A.R. Allouche, M. Korek, K. Fakherddin, A. Chalaan, M. Dagher, F. Taher, and M. Aubert-Frécon, J. Phys. B 33, 2307 (2000) 17 M. Marinescu and H. R. Sadeghpour, Phys. Rev. A 59, 390-404 (1999) 18 Relativistic potentials are available [H. Fahs, A. R. Allouche, M. Korek, and M. Aubert-Frécon, J. Phys. B, 35, 1501 (2002)], however, since we include adjustable spinorbit functions explicitly in our calculations we made use of the previous non-relativistic results16. 19 D.T. Colbert and W.H. Miller, J. Chem. Phys. 96, 1982 (1992) 20 E. Tiesinga, C.J. Williams, and P.S. Julienne, Phys. Rev. A 57, 4257 (1998) 21 C. M. Dion, C. Drag, O. Dulieu, B. Laburthe Tolra, F. Masnou-Seeuws, and P. Pillet , Phys. Rev. Lett. 86, 2253 (2001) - 17 -
