NOD2 gene polymorphism rs2066844 associates with need
advertisement
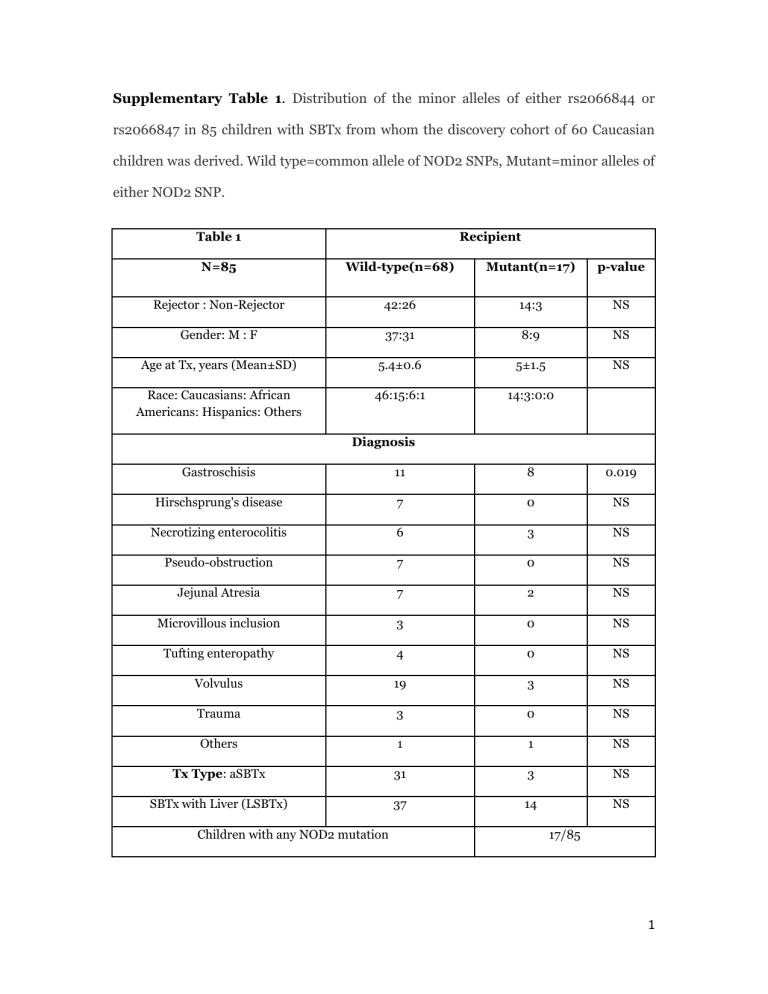
Supplementary Table 1. Distribution of the minor alleles of either rs2066844 or rs2066847 in 85 children with SBTx from whom the discovery cohort of 60 Caucasian children was derived. Wild type=common allele of NOD2 SNPs, Mutant=minor alleles of either NOD2 SNP. Table 1 Recipient N=85 Wild-type(n=68) Mutant(n=17) p-value Rejector : Non-Rejector 42:26 14:3 NS Gender: M : F 37:31 8:9 NS Age at Tx, years (Mean±SD) 5.4±0.6 5±1.5 NS Race: Caucasians: African Americans: Hispanics: Others 46:15:6:1 14:3:0:0 Diagnosis Gastroschisis 11 8 0.019 Hirschsprung's disease 7 0 NS Necrotizing enterocolitis 6 3 NS Pseudo-obstruction 7 0 NS Jejunal Atresia 7 2 NS Microvillous inclusion 3 0 NS Tufting enteropathy 4 0 NS Volvulus 19 3 NS Trauma 3 0 NS Others 1 1 NS Tx Type: aSBTx 31 3 NS SBTx with Liver (LSBTx) 37 14 NS Children with any NOD2 mutation 17/85 1 Supplementary Table 2: Causes of graft loss and death for 85 children from whom the discovery cohort of 60 Caucasian children was derived. These 85 children include 51 with LSBTx, and 34 with isolated SBTx. LSBTx (n=51) Causes of Death Deaths Causes of Graft Loss Grafts lost Sepsis 3 Chronic Rejection 2 End Stage Mitochondrial Complex Disease 1 Acute Rejection 2 Intraventricular Hemorrhage 1 Sepsis 2 Total Deaths n=5 (9.8%) Acute Rejection and Chronic Rejection 1 End Stage Mitochondrial Complex Disease 1 Intraventricular Hemorrhage 1 Total Graft Loss n=9 (17.6%) Isolated SBTx (n=34) Sepsis 1 Chronic Rejection 6 GVHD+ Sepsis 1 PTLD 3 Acute Renal Failure 1 GVHD+ Sepsis 1 Total Deaths n=3 (8.8%) ARF 1 Technical 1 Total Graft Loss n=12 (35.3%) 2 Supplementary Table 3. Linear regression analysis statistics for 41 rATG induced Caucasians from the discovery cohort who received either LSBTx (N=24) oriIsolated SBTx (N=17). Early Rejection N = 24 (LSBTx, N=24) coefficients p-value Age at Tx 0.500 0.037 Gender -0.250 rs2066844 0.500 Early Rejection N = 17 (isolated SBTx, N=17) coefficients p-value Age at Tx 0.214 0.622 0.137 Gender 0.143 0.622 0.017 SNP 8 0.286 0.622 3
